REVEALED: The Most Normal States In America
11. Michigan

10. Georgia

Why it's normal: Georgia was very close to the national norm on a few indicators. Compared to 14.5% of workers in America, 15.5% of workers in Georgia were employed in the public sector. Educational attainment was also fairly close to the U.S. average — 28.2% of Georgians had a bachelor's degree or higher, as did 29.1% of people in the country.
Why it's weird: Georgia is a huge center of African American life, and has a much higher proportion of African Americans than the country as a whole. The percentage of Georgians who identified as black or African American was 30.5% — almost 2 1/2 times the national proportion of 12.3%.
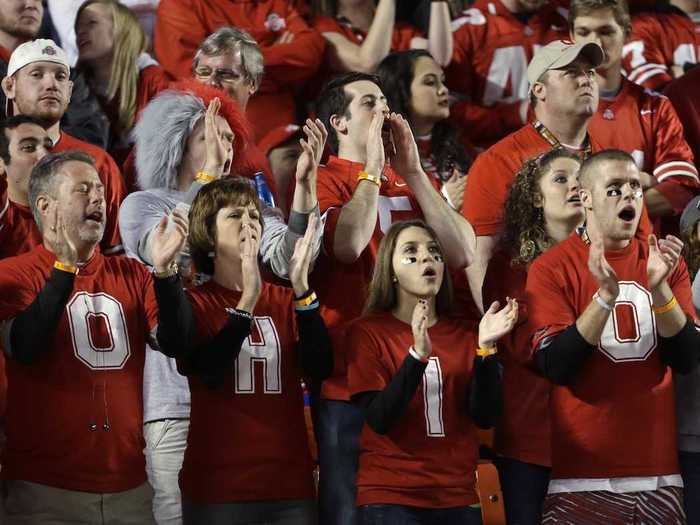
9. Ohio

Why it's normal: Ohio was close to the national average on two of the demographic racial indicators: people identifying as two or more races (Ohio: 2.0%, U.S.: 2.1%), and people identifying as black (Ohio: 12.1%, U.S.: 12.3%). Ohioans of both sexes were also married at very similar rates to Americans at large — 50.0% of Ohio men and 46.2% of Ohio women were married, compared to 49.8% of American men and 46.3% of American women.
Why it's weird: Ohio diverged from the U.S. on two of the other demographic racial indicators — 80.6% of Ohioans were Non-Hispanic white, whereas only 62.8% of Americans identified this way. Conversely, only 3.2% of Ohioans were Hispanic or Latino, as opposed to 16.9% of Americans. More Ohioans also spoke only English at home (93.3%) than did overall Americans (79.0%).
8. Missouri

Why it's normal: Missouri fell at or near the national average for a bunch of demographic indicators: the proportions of multiracial and black Missourians were close to those of the entire country, as was the proportion of Missourians identifying as some other race. Missouri's rate of 16.2% of people whose incomes fell under the poverty line was close to the national poverty rate of 15.9%.
Why it's weird: Missouri was similar to Ohio in that Missourians identifying as white (80.5%) were overrepresented, and Missourians identifying as Hispanic/Latino (3.7%) were underrepresented.
7. Delaware

Why it's normal: Delaware's marriage rate for men was identical to the national rate — 49.8% — although the rate for women was slightly lower than for the country — 45.1% of Delaware women were married, as opposed to 46.3% of American women. The average length of a Delawarean's commute was very close to the national average: 25.8 minutes in Delaware, and 25.7 minutes in the U.S. as a whole.
Why it's weird: Delawareans were less likely to be in poverty than other Americans (DE: 12.0%, U.S.: 15.9%), and they were more likely to have health insurance before the implementation of the Affordable Care Act (DE: 91.2%, U.S.: 85.2%). However, Delaware had more vacant housing units than other states — 17.1% for Delaware, as opposed to 12.4% in the nation overall.
6. Arizona

Why it's normal: Median apartment rent in Arizona was $888, just four dollars more than the national median of $884. Close to the 13.0% rate for the U.S., 13.4% of Arizona's population was born in another country.
Why it's weird: Despite being close to the country as a whole on the proportion of residents born abroad, Arizona's foreign-born residents were less likely to be naturalized citizens — 60.7% of Arizona's foreign born population were non-citizens, while the national proportion was about 54.2%. The effects of the housing boom can also be seen clearly in Arizona — 27.1% of houses in Arizona have been built since 2000, but only 15.8% of houses in the United States were that young.
5. Indiana

Why it's normal: Families with children under the age of 18 accounted for 29.0% of households in Indiana — the exact same proportion as in the United States. Indiana also had the exact same gender ratio as the country as a whole: 50.8% of both Hoosiers and Americans were women.
Why it's weird: Indiana had a very small proportion of foreign-born residents — only 4.6% came from abroad. Indiana also lagged the country in educational attainment — 23.4% of Indianans over the age of 25 had at least a bachelor's degree, as opposed to 29.1% of Americans in the same age range.
4. North Carolina

Why it's normal: As with Indiana, the proportion of households with children tracked close to the national norm: 28.9% of households in North Carolina, and 29.0% in the United States. Mortgage holders accounted for 66.0% of houses in North Carolina, as did 65.7% in the country overall.
Why it's weird: North Carolina had fewer foreign-born residents than average — 7.7% in North Carolina as opposed to 13.0% in America. Further, these residents were much less likely to be citizens — 68% of North Carolina's foreign-born population were non-citizens, compared to 54.2% nationwide.
3. Oregon

Why it's normal: 85.1% of Oregonians had health insurance in 2012, as did 85.2% of Americans. Oregon's median apartment rent was $862, close to the national median of $884.
Why it's weird: Oregon had a much smaller black population than the U.S. — only 1.7% of Oregonians identified as black or African American, compared to 12.3% in the nation as a whole. Oregonians were also a bit more likely to have recently moved to a new house — 81.9% of Oregonians lived in the same house at the time they were surveyed as they did the year before, while 85.0% of Americans did.
2. Washington

Why it's normal: Washington was close to the national norm on a number of metrics. Washington's median age was 37.5 years, and the national median was 37.4. People with disabilities made up 12.0% of Washington's population, compared to 12.2% of Americans. Washington's birth rate was 55 births per 1,000 women, and the country's was 54.
Why it's weird: Like its neighbor Oregon, Washington had relatively few black residents — only 3.5% of Washingtonians identified as black or African American, as opposed to 12.3% of Americans. Washingtonians were more likely to have served in the military — 11.2% of Washington's residents were veterans who have left the service, as opposed to only 8.9% of the U.S. population.
1. Illinois

Why it's normal: Illinois is a microcosm of America. On most of the indicators used, Illinois fell very close to the national total. Average household size was exactly the same for Illinois as for the country as a whole: 2.64 people. The racial breakdown of Illinois was extremely similar to that of the United States, the only exceptions were that people who identify as black or African American were slightly overrepresented (Ill.: 14.2%, U.S.: 12.3%), and people who identify as some other race were underrepresented (Ill.: 0.2%, U.S.: 1.1%).
Why it's weird: Illinois is mostly weird because of how close it is to the rest of the country. Very few of the indicators for Illinois are at all far from the national totals. Illinois did have slightly fewer veterans than the U.S. as a whole — 7.5% as opposed to 8.9%. The commute in Illinois was also slightly longer than the national average: 28 minutes for Illinois and 25.7 minutes for the entire country.
Popular Right Now
Popular Keywords
Advertisement
