Car accidents happen in every city, but drivers are more prone to them in certain cities.Peter Stark/Getty Images
- Forbes Advisor ranked the most dangerous cities for traffic accidents across the US.
- Atlanta and Dallas tied for the top city where you're most likely to get in a car accident.
Traffic accidents are always a risk when you get behind the wheel, but this is especially true for drivers in busier, urban areas.
Using research from the National Highway Traffic Safety Administration and Allstate, Forbes Advisor identified the cities where you're most likely to get in a car accident.
Its report, which looked at data for the 50 largest cities in the US, considered three key metrics: motor-vehicle accident fatality rates, the average years between collisions for drivers, and the likelihood of a crash compared to the national average.
While the highest-risk cities for collisions are spread across the US, they include ones with limited public transportation systems, such as Los Angeles and Atlanta.
Here are the top 10 cities where you're most likely to get in a car accident.
10. Los Angeles, California
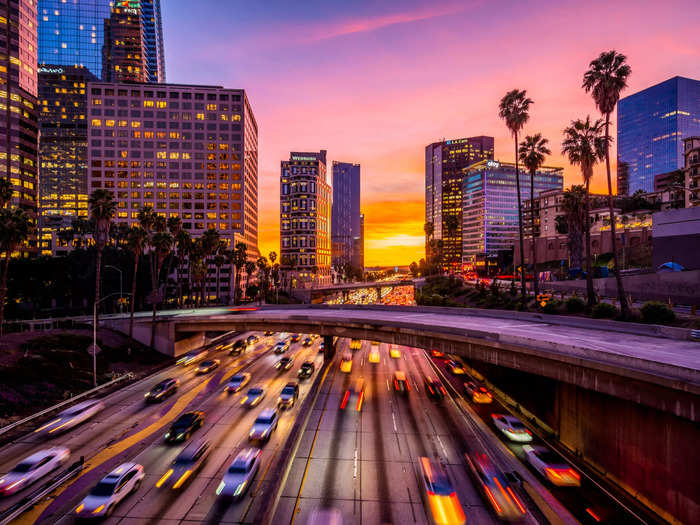
Busy traffic in Downtown Los Angeles at sunset. yongyuan/Getty Images
In Los Angeles, drivers have the fourth-highest likelihood of a collision compared to the national average. There are typically about six years between collisions for drivers.
Motor-vehicle fatality rate per 100,000 population: 7.1
Average years between collisions for a driver: 5.81
Collision likelihood when compared with the national average: 82%
9. Louisville, Kentucky
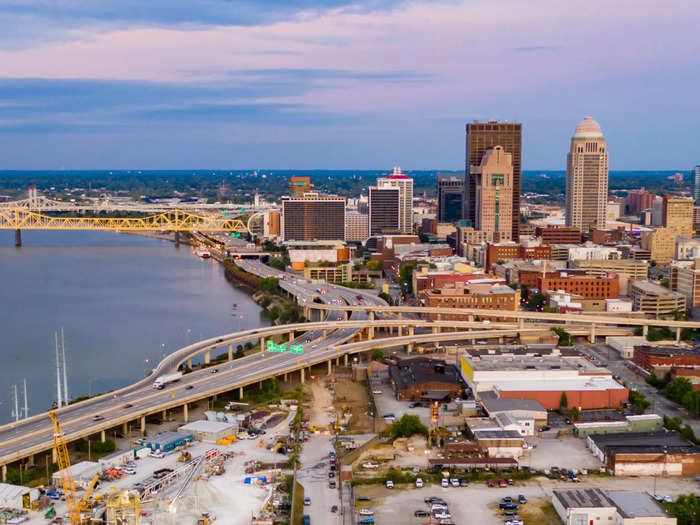
Colorful bridges lead into the buildings and streets of the downtown city center of Louisville, Kentucky. ChrisBoswell/Getty Images
Louisville, Kentucky, has the sixth-highest fatality rate per 100,000 residents.
Fatality rate per 100,000 population: 18.3
Average years between collisions: 9.10
Relative collision likelihood: 16.3%
8. Houston, Texas
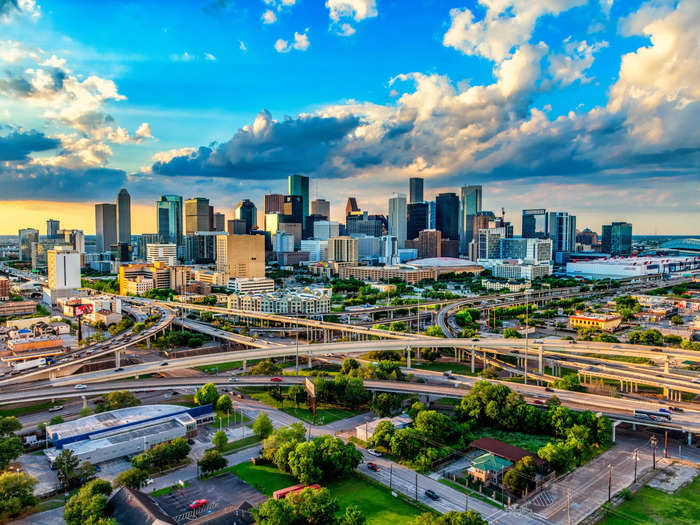
The skyline of Houston, Texas, at sunset. Art Wager/Getty Images
Houston, Texas, does not rank in the top 10 of Forbes' three metrics, but it was still named as the eighth city where drivers are most likely to get in a crash.
Fatality rate per 100,000 population: 11.5
Average years between collisions: 7.66
Relative collision likelihood: 38.1%
7. Fresno, California
Fresno, California. Shunyu Fan/Getty Images
While Fresno, California, does not top the lists of any of the key metrics, it's still one of the more dangerous cities for drivers across the country.
Fatality rate per 100,000 population: 13.4
Average years between collisions: 8.02
Relative collision likelihood: 31.9%
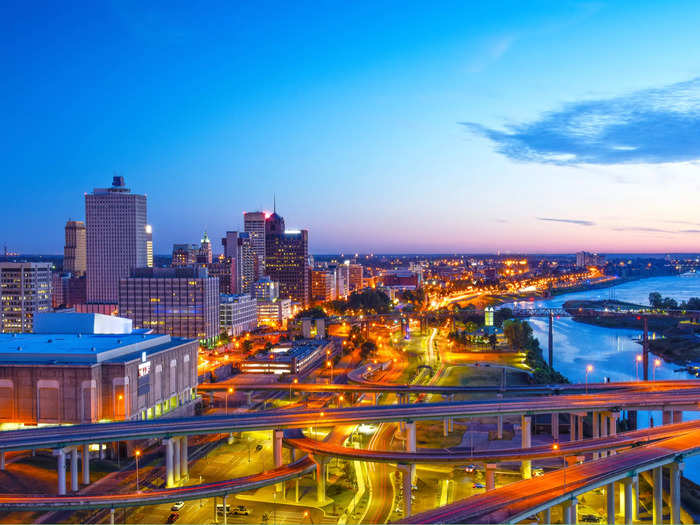
6. Memphis, Tennessee
Highways converge in downtown Memphis, Tennessee, as they approach the Mississippi River. John Coletti/Getty Images
Memphis, Tennessee, tops the list for the highest fatality rate per 100,000 residents.
Fatality rate per 100,000 population: 34.3
Average years between collisions: 9.05
Relative collision likelihood: 16.9%
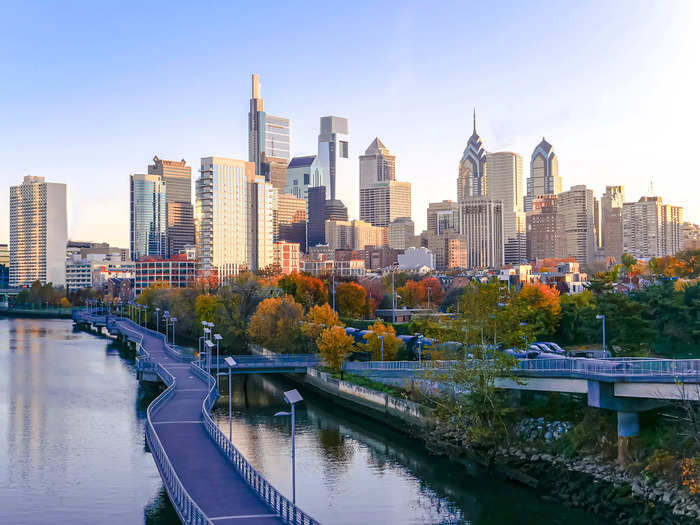
5. Philadelphia, Pennsylvania
Philadelphia, Pennsylvania skyline in autumn. Olga Kaya/Getty Images
Philadelphia ranks sixth for the least amount of time between collisions per driver and it is the sixth-highest city for the likelihood of a collision when compared with the national average.
Fatality rate per 100,000 population: 10.5
Average years between collisions: 6.33
Relative collision likelihood: 67%
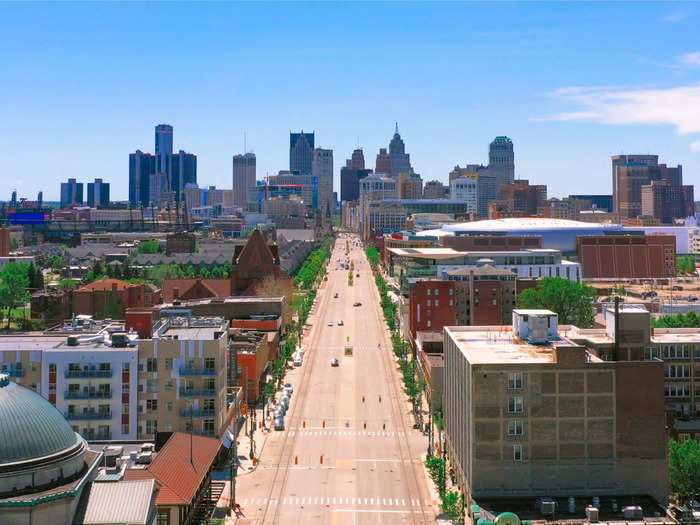
4. Detroit, Michigan
Aerial view of Woodward Avenue in Detroit, Michigan. pawel.gaul/Getty Images
Detroit follows closely behind Memphis, Tennessee, for the second-highest fatality rate per 100,000 residents.
Fatality rate per 100,000 population: 28.7
Average years between collisions: 8.61
Relative collision likelihood: 22.9%
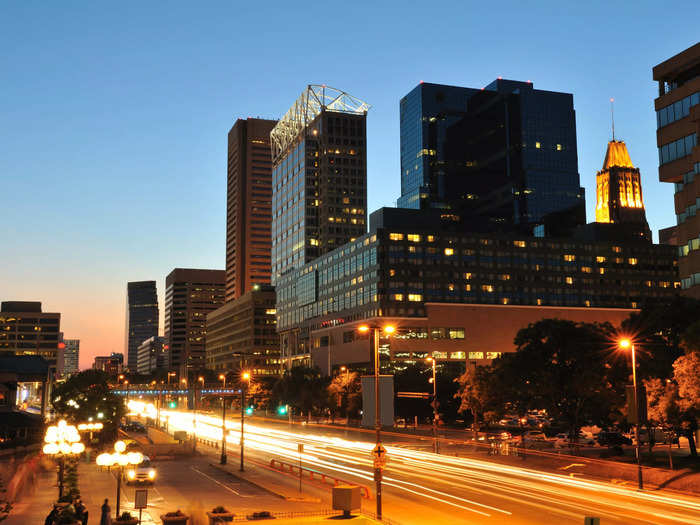
3. Baltimore, Maryland
Downtown Baltimore, Maryland, at dusk. aimintang/Getty Images
Baltimore tops the list for the city with the least amount of time between collisions per driver, which shows the higher frequency of accidents in this area. Forbes Advisor identifies the city's high-speed expressways as partially to blame for the increased chances of a crash. It is also the city with the highest relative collision likelihood.
Fatality rate per 100,000 population: 10.6
Average years between collisions: 4.19
Relative collision likelihood: 152.5%
1. Dallas, Texas
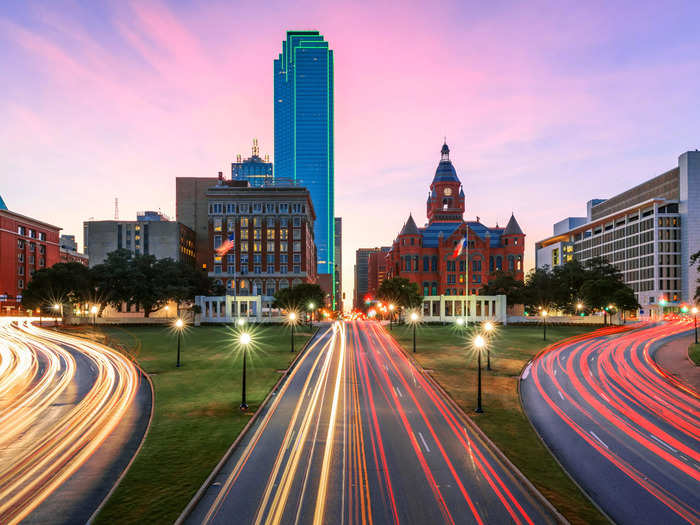
Dealey Plaza, The Grasy Knoll, Old Red Museum of Dallas County History & Culture in Dallas, Texas. joe daniel price/Getty Images
Tied for the No. 1 spot is Dallas, which was named in the top 10 for each of the key metrics. Compared to other large US cities, it has the eighth-highest fatality rate per 100,000 residents. For the other two metrics, it earned the 10th spot.
Fatality rate per 100,000 population: 16.5
Average years between collisions: 7.22
Relative collision likelihood: 46.5%
1. Atlanta, Georgia
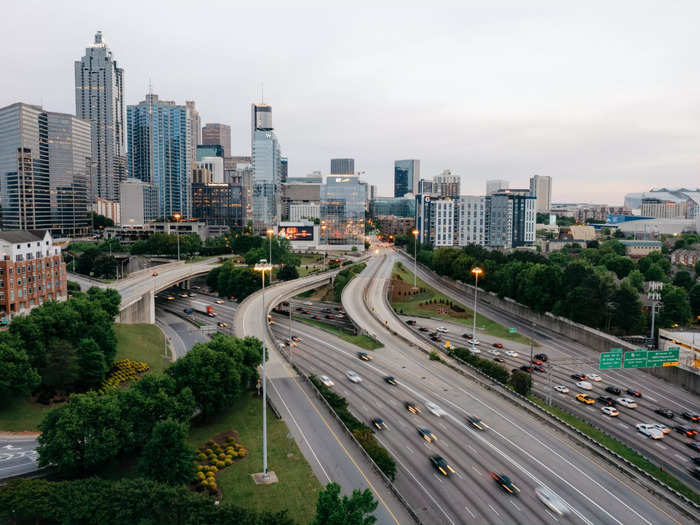
Downtown Atlanta, Georgia, on a busy, cloudy day. Marilyn Nieves/Getty Images
Atlanta — which ties Dallas for the No. 1 spot — also made the top 10 for each of the metrics. It is the ninth city with the highest fatality rate per 100,000 residents, the ninth-highest city with the least amount of time between collisions per driver, and has the ninth-highest relative collision likelihood.
Fatality rate per 100,000 population: 15.8
Average years between collisions: 7.07
Relative collision likelihood: 49.5%

