MAPS: Where Every Ancestry Group In America Lives
49,840,035 Germans live mostly in the Midwest

35,751,251 Irish are strongest in the North East
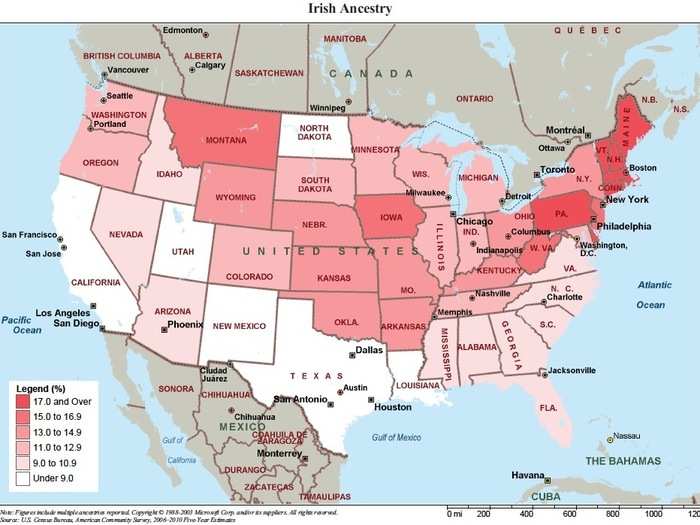
From "Ancestry & Ethnicity in America" based on the American Community Survey (2006–2010 Five Year Estimate). Respondents could name more than one ancestry group or race.
31,798,258 Mexicans are strongest west of the Mississippi
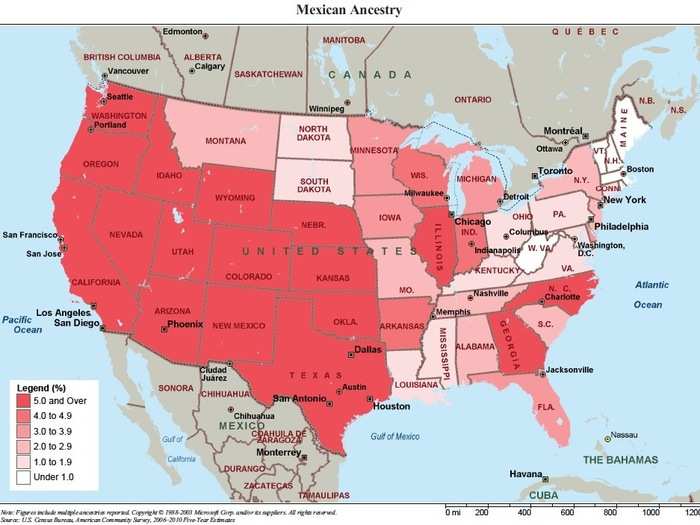
From "Ancestry & Ethnicity in America" based on the American Community Survey (2006–2010 Five Year Estimate). Respondents could name more than one ancestry group or race.
27,404,243 English are strongest in the North East and North West
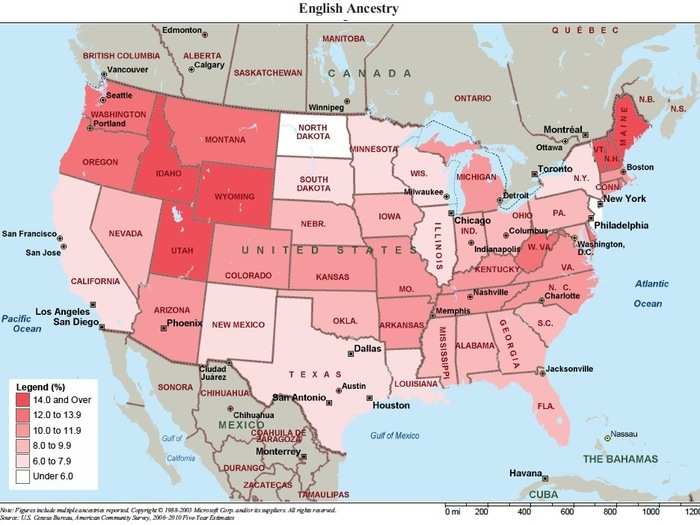
From "Ancestry & Ethnicity in America" based on the American Community Survey (2006–2010 Five Year Estimate). Respondents could name more than one ancestry group or race.
19,094,109 Americans are found mostly in the South East (people select this ancestry either as a political statement or because their pre-American ancestry is uncertain)
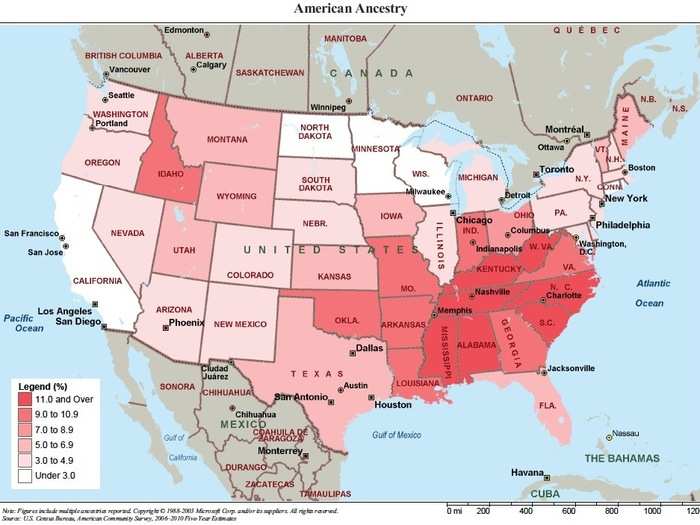
From "Ancestry & Ethnicity in America" based on the American Community Survey (2006–2010 Five Year Estimate). Respondents could name more than one ancestry group or race.
17,571,808 Italian are strongest in the North East
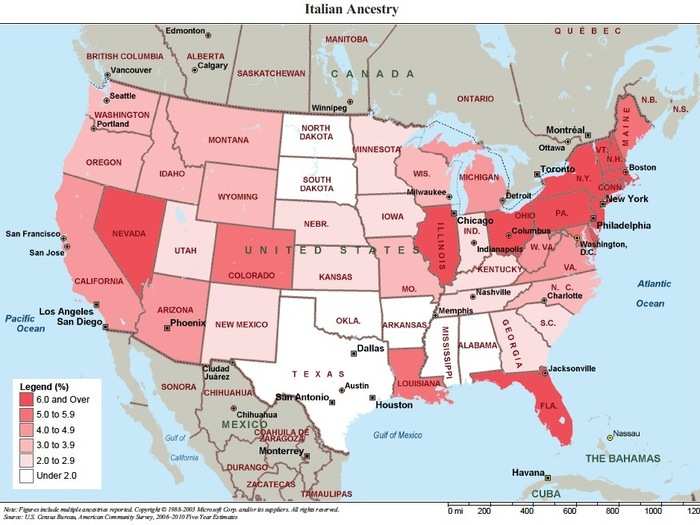
From "Ancestry & Ethnicity in America" based on the American Community Survey (2006–2010 Five Year Estimate). Respondents could name more than one ancestry group or race.
9,835,471 Polish are strongest in the North East and Great Lakes region
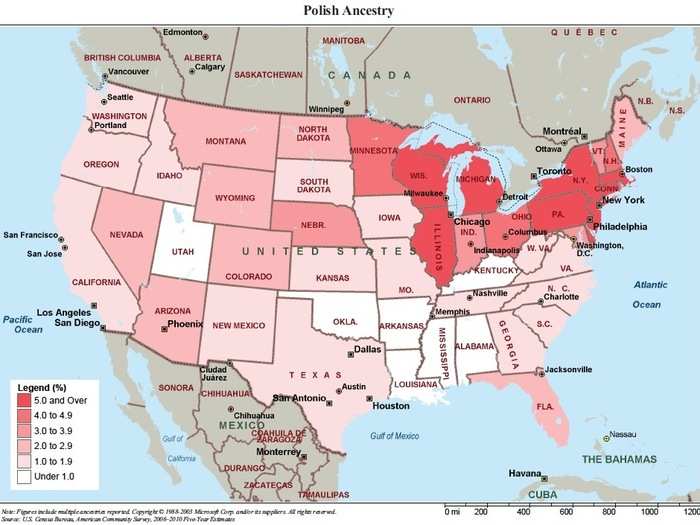
From "Ancestry & Ethnicity in America" based on the American Community Survey (2006–2010 Five Year Estimate). Respondents could name more than one ancestry group or race.
9,326,380 French (except Basque) are strongest in New England and Louisiana
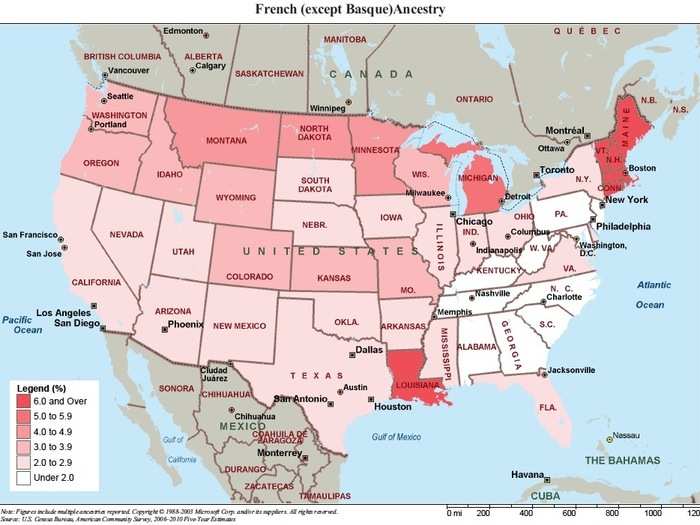
From "Ancestry & Ethnicity in America" based on the American Community Survey (2006–2010 Five Year Estimate). Respondents could name more than one ancestry group or race.
5,821,321 Scottish are strongest in the North East and North West, like the English
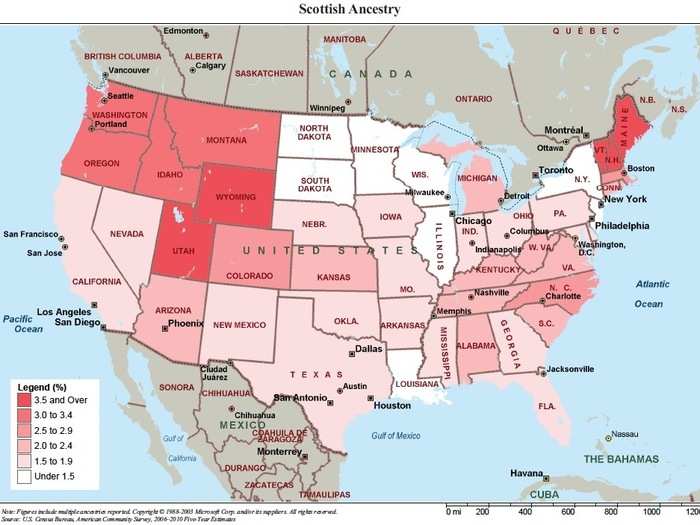
From "Ancestry & Ethnicity in America" based on the American Community Survey (2006–2010 Five Year Estimate). Respondents could name more than one ancestry group or race.
5,227,887 Scotch-Irish (aka Irish Presbyterians from Ulster) are surprisingly strong in the Carolinas and Tennessee
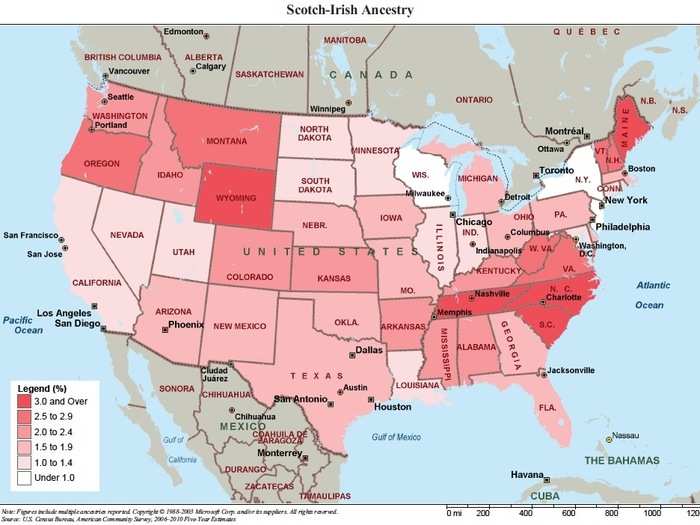
From "Ancestry & Ethnicity in America" based on the American Community Survey (2006–2010 Five Year Estimate). Respondents could name more than one ancestry group or race.
4,950,629 Dutch are strongest in the Midwest and North West
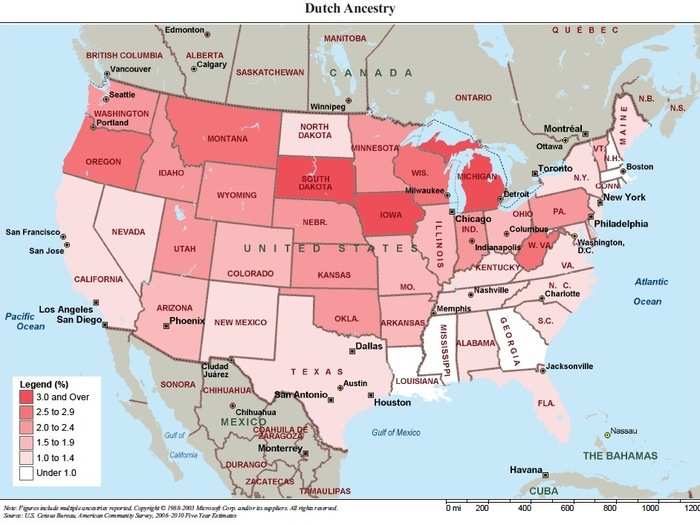
From "Ancestry & Ethnicity in America" based on the American Community Survey (2006–2010 Five Year Estimate). Respondents could name more than one ancestry group or race.
4,623,716 Puerto Ricans are strongest in Florida, Illinois, and the North East
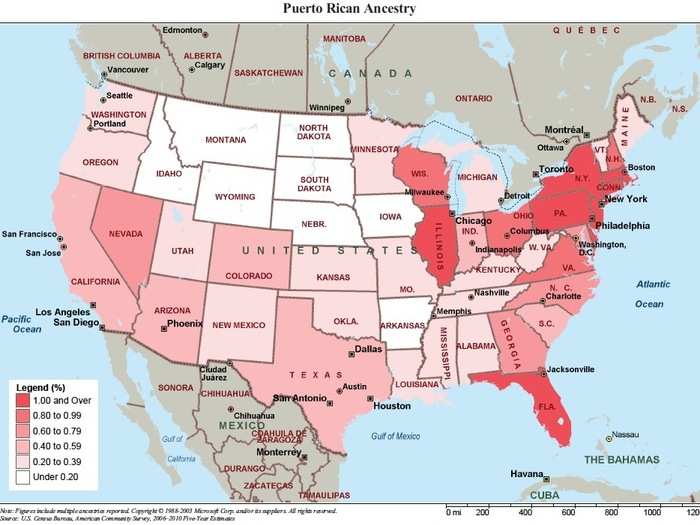
From "Ancestry & Ethnicity in America" based on the American Community Survey (2006–2010 Five Year Estimate). Respondents could name more than one ancestry group or race.
4,602,337 Norwegians are strongest in the West, North West, and Midwest
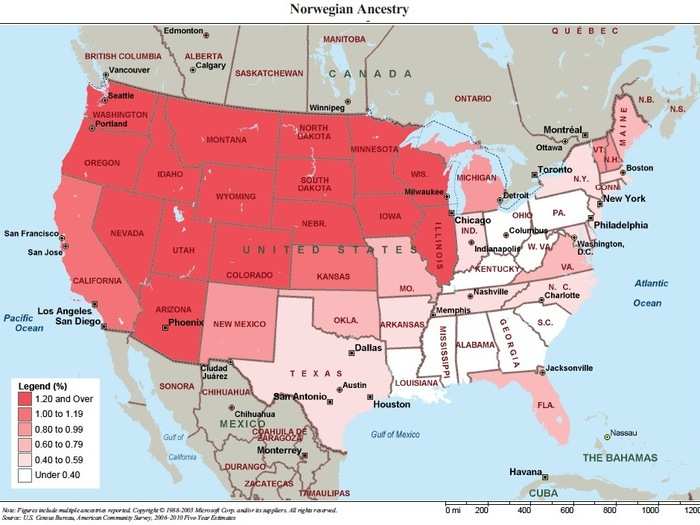
From "Ancestry & Ethnicity in America" based on the American Community Survey (2006–2010 Five Year Estimate). Respondents could name more than one ancestry group or race.
4,293,208 Swedish are found in similar places, but also New England
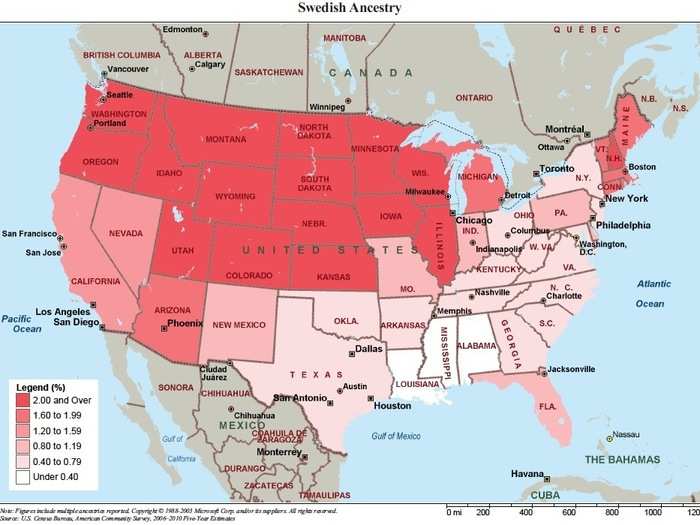
From "Ancestry & Ethnicity in America" based on the American Community Survey (2006–2010 Five Year Estimate). Respondents could name more than one ancestry group or race.
3,794,673 Chinese (except Taiwanese) are strongest on the West Coast and urban North East
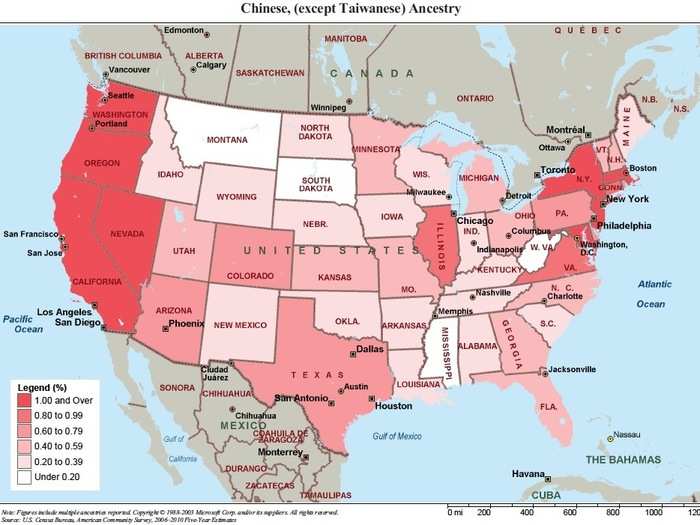
From "Ancestry & Ethnicity in America" based on the American Community Survey (2006–2010 Five Year Estimate). Respondents could name more than one ancestry group or race.
3,416,840 Filipino are strongest on the West Coast, Illinois, and the urban East Coast
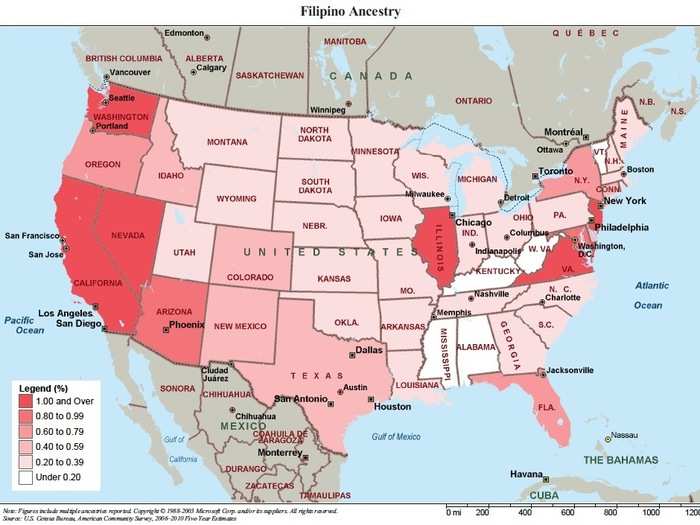
From "Ancestry & Ethnicity in America" based on the American Community Survey (2006–2010 Five Year Estimate). Respondents could name more than one ancestry group or race.
3,183,063 Asian Indian are found in communities around the country
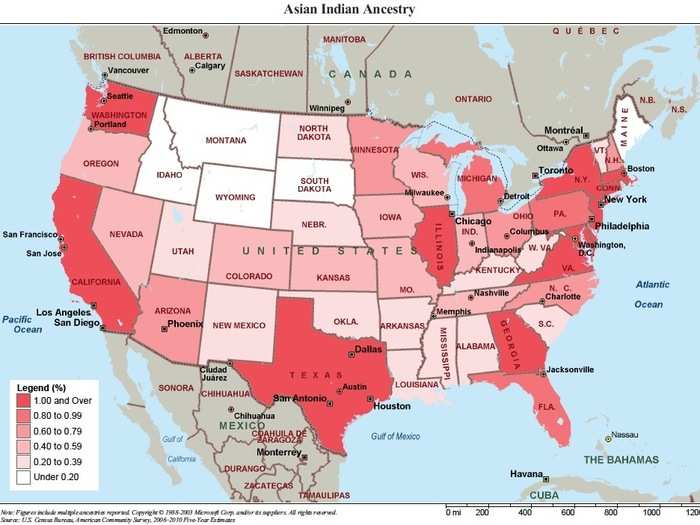
From "Ancestry & Ethnicity in America" based on the American Community Survey (2006–2010 Five Year Estimate). Respondents could name more than one ancestry group or race.
3,072,756 Russian tend to avoid the South, except for Florida
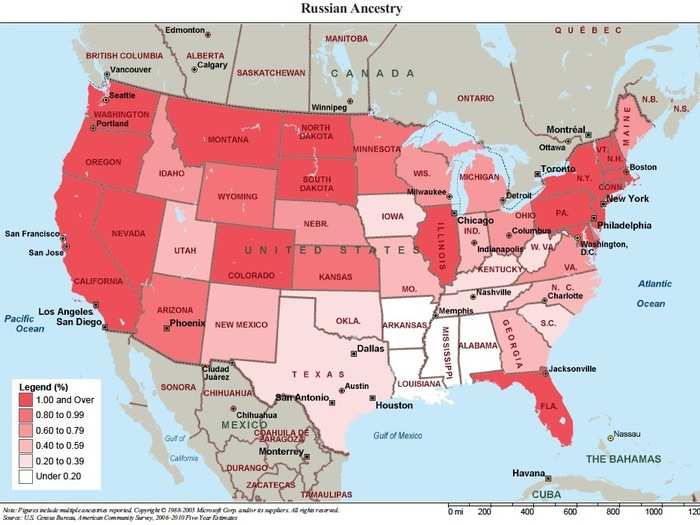
From "Ancestry & Ethnicity in America" based on the American Community Survey (2006–2010 Five Year Estimate). Respondents could name more than one ancestry group or race.
2,138,601 French Canadians are found along the Canadian border and in Louisiana
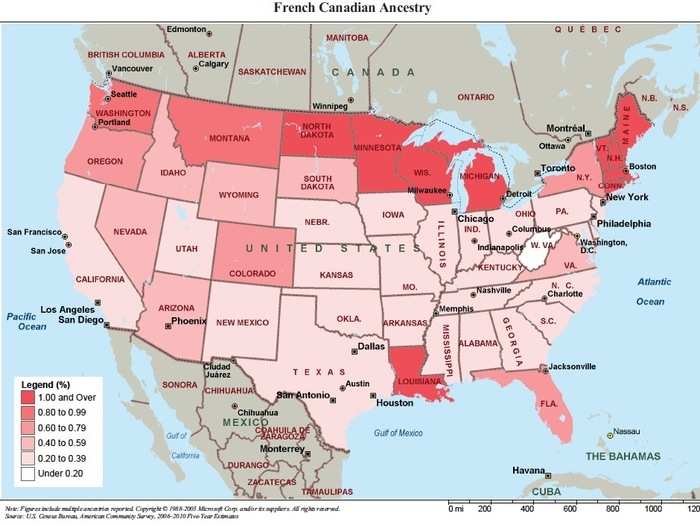
From "Ancestry & Ethnicity in America" based on the American Community Survey (2006–2010 Five Year Estimate). Respondents could name more than one ancestry group or race.
1,922,914 Welsh live in similar places to the English and Scots
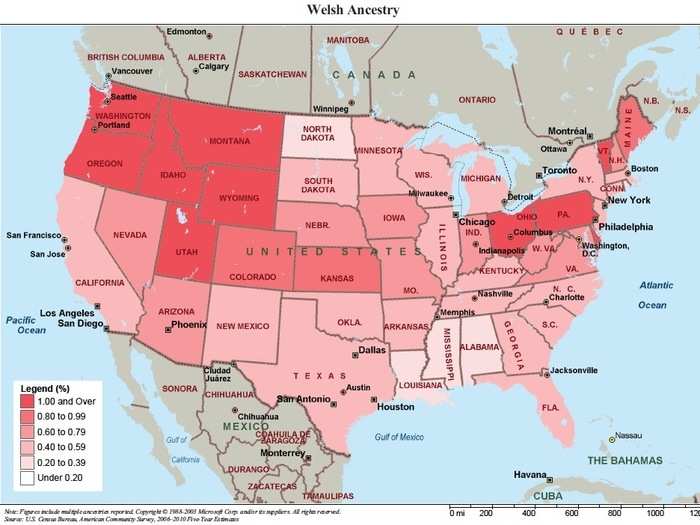
From "Ancestry & Ethnicity in America" based on the American Community Survey (2006–2010 Five Year Estimate). Respondents could name more than one ancestry group or race.
50,477,594 Hispanics are strongest in the South West, as well as in Florida, Illinois, and New York
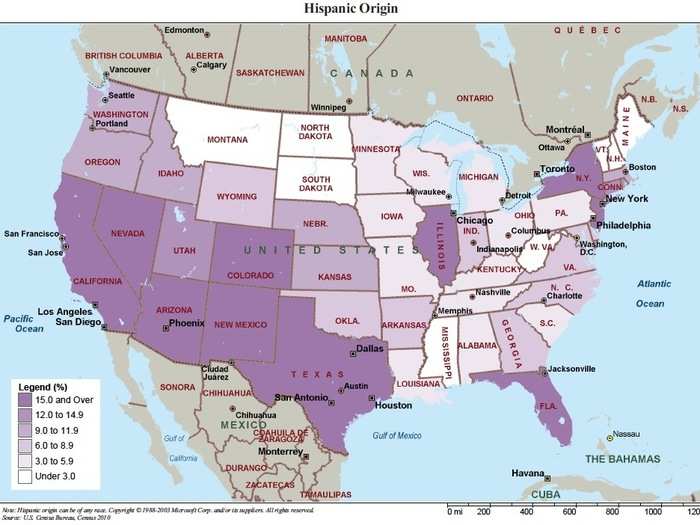
From "Ancestry & Ethnicity in America" based on the American Community Survey (2006–2010 Five Year Estimate). Respondents could name more than one ancestry group or race.
231,040,398 White people are most common in New England and the Midwest
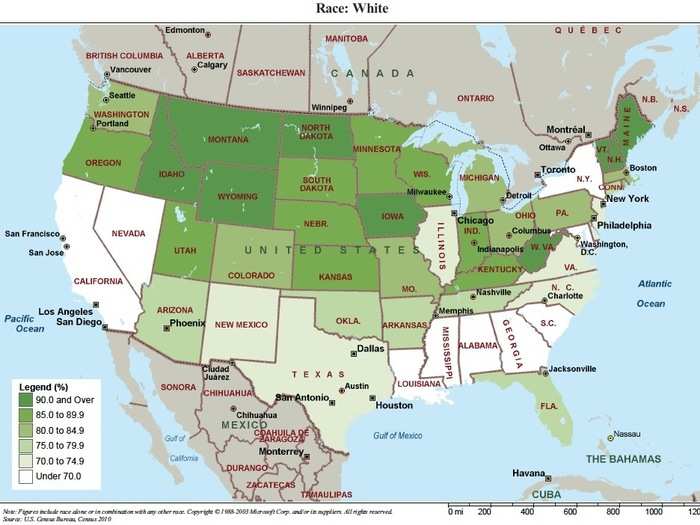
From "Ancestry & Ethnicity in America" based on the American Community Survey (2006–2010 Five Year Estimate). Respondents could name more than one ancestry group or race.
42,020,743 African American or black people are most common in the South East
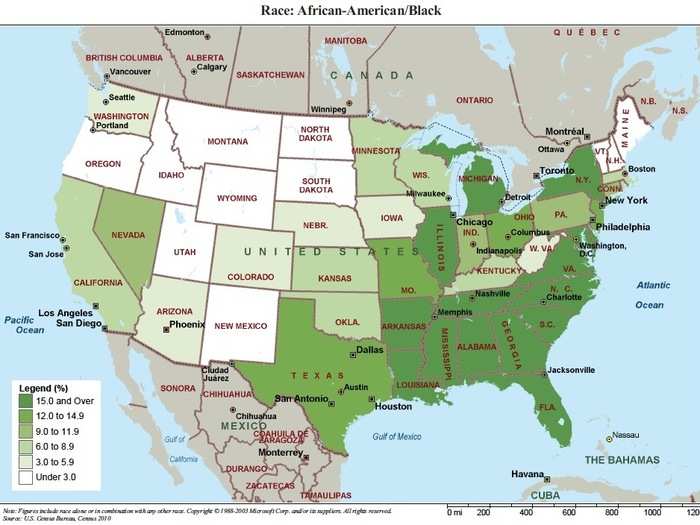
From "Ancestry & Ethnicity in America" based on the American Community Survey (2006–2010 Five Year Estimate). Respondents could name more than one ancestry group or race.
17,320,856 Asians are most common on the West Coast and urban East Coast
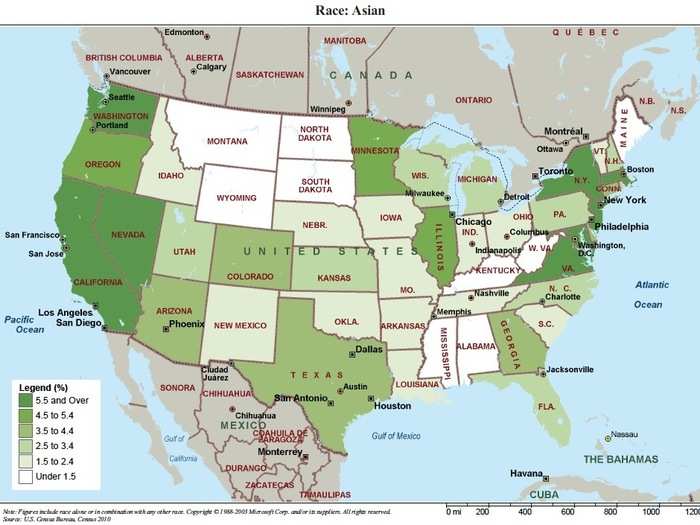
From "Ancestry & Ethnicity in America" based on the American Community Survey (2006–2010 Five Year Estimate). Respondents could name more than one ancestry group or race.
5,220,579 American Indian or Alaska Native are most common in the West (unfortunately this map does not show Alaska ...)
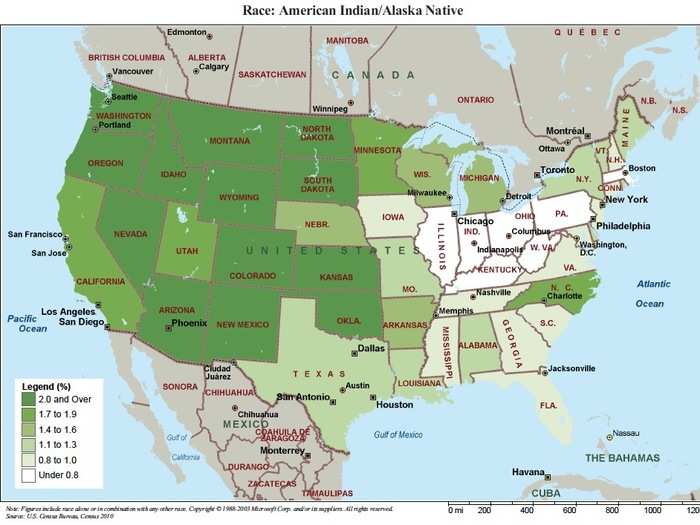
From "Ancestry & Ethnicity in America" based on the American Community Survey (2006–2010 Five Year Estimate). Respondents could name more than one ancestry group or race.
1,225,195 Hawaii Native or Pacific Islander are most common in the West (unfortunately this map does not show Hawaii ...))
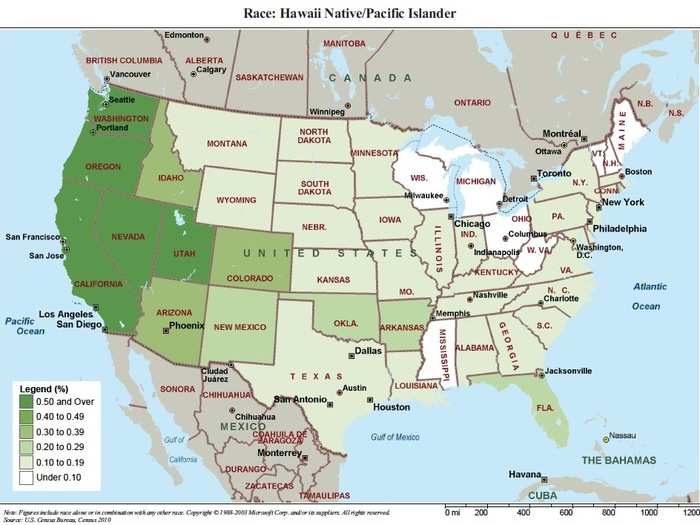
From "Ancestry & Ethnicity in America" based on the American Community Survey (2006–2010 Five Year Estimate). Respondents could name more than one ancestry group or race.
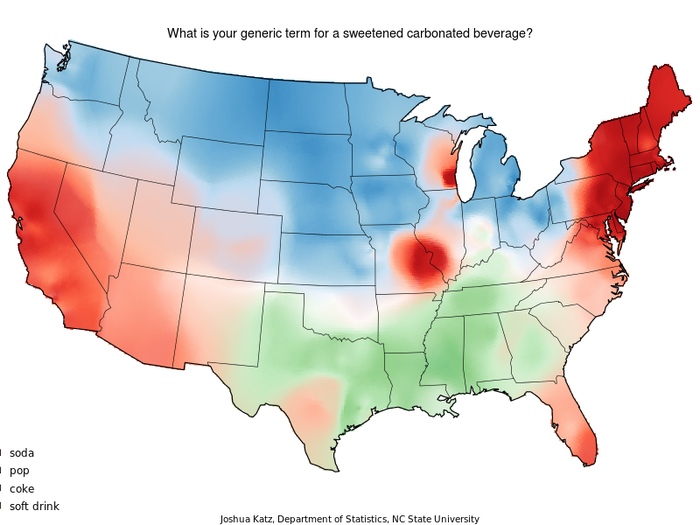
Maybe that's why we speak so differently
Popular Right Now
Advertisement