Facebook, Google, and Apple are using data from millions of users to map COVID-19 and people's movements. Here are all the coronavirus maps and dashboards made by tech giants you can explore today.
Aaron Holmes
- Apple, Google, and Facebook are collecting data on people's movement from smartphone apps and using it to show where people have reduced their mobility or reported coronavirus symptoms.
- The three tech giants have had access to this data for years, but are now publishing some of it in the form of reports on the spread of COVID-19.
- Each company has published COVID-19 dashboards with charts and tables on the virus. Take a look.
- Visit Business Insider's homepage for more stories.
Tech giants are joining the fight against coronavirus — and in the process, they're giving us a look under the hood at some of the user data they've been tracking all along.
Facebook, Google, and Apple have all released maps and dashboards in recent weeks powered by information from millions of users that show how COVID-19 is spreading. Each visualization reflects the unique type of data that each tech company is poised to collect from users.
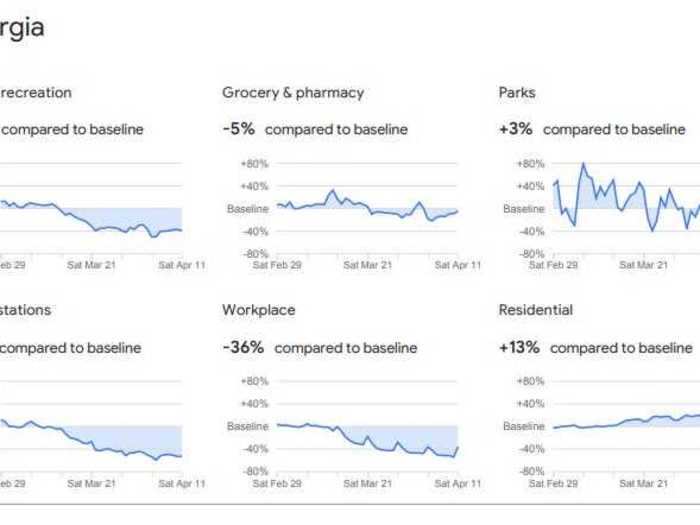
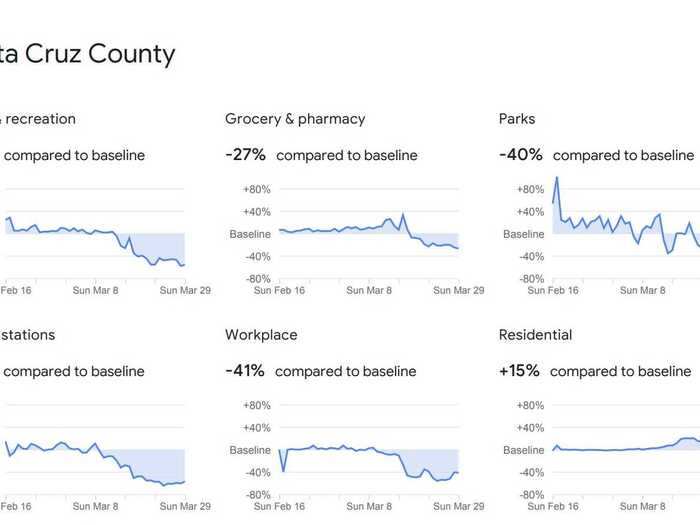
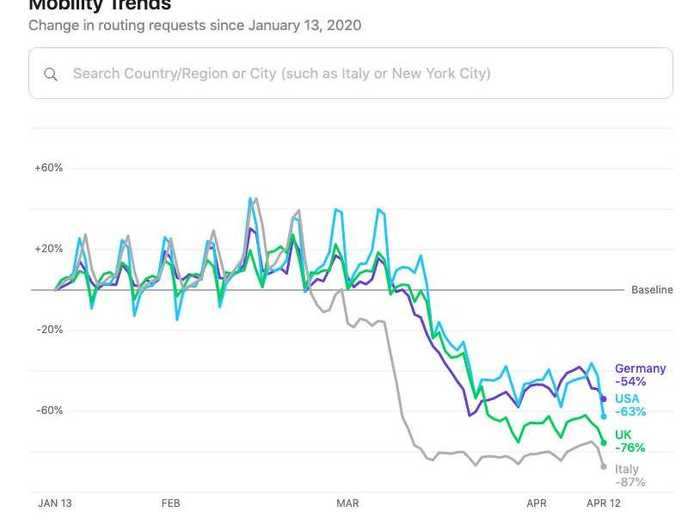
Google and Apple both released tools that show people's mobility in specific areas and how much it's decreased amid government-mandated shutdowns. In both cases, the companies gleaned this data from people using Apple Maps and Google Maps, as well as location data from iPhone and Android users, respectively.
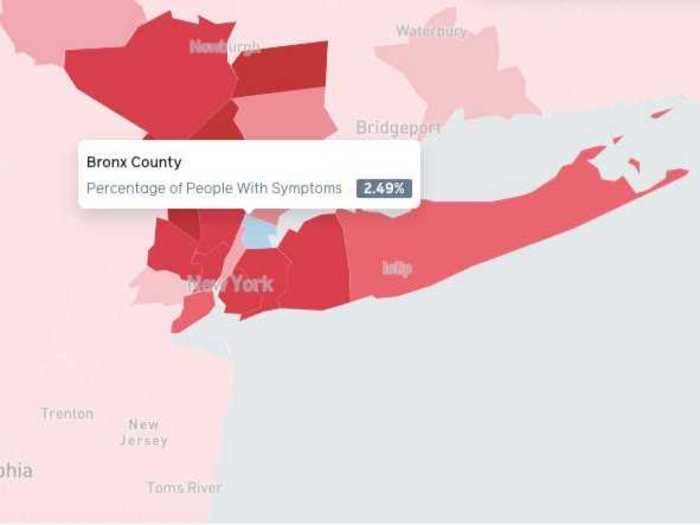
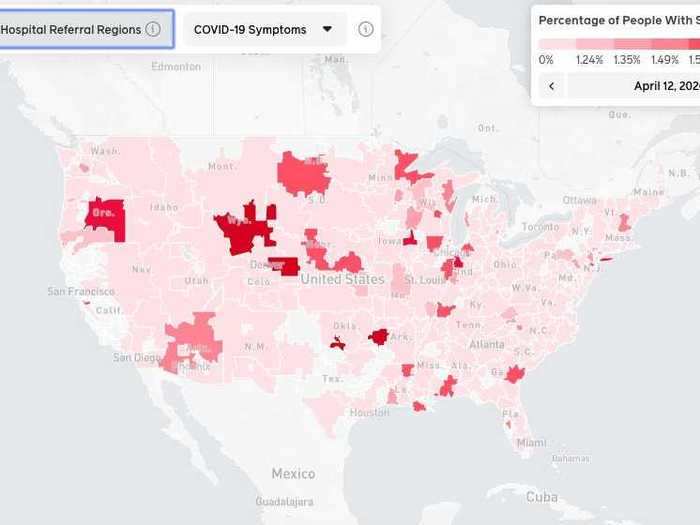
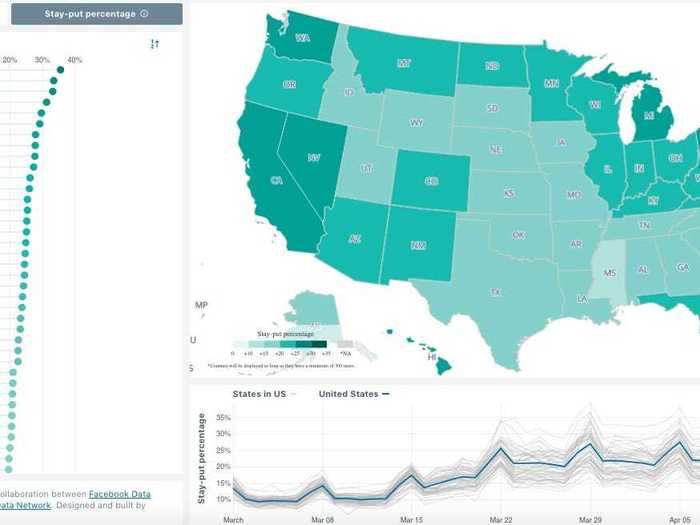
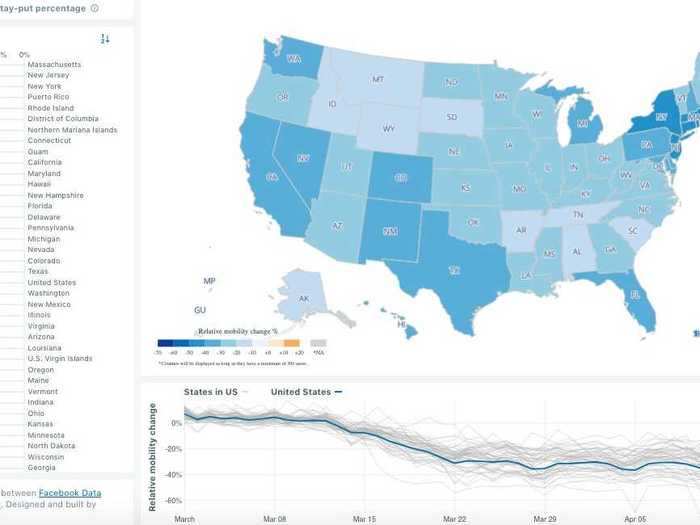
Facebook published a map showing how many people are reporting COVID-19 symptoms in each county in the US, gathering data by surveying millions of Facebook users. This week, the company also released a mobility dashboard that aggregates information on people's movements from a conglomerate of private companies, as well as public resources like satellite imagery and census data.
In all cases, the tech giants insist that the data is anonymized and can't be traced back to individuals. Privacy is also a central focus of forthcoming contact-tracing tech from Apple and Google that would use Bluetooth to alert people who come in contact with COVID-19 without tracking their location.
Here are all of the COVID-19 maps, charts, and dashboards from major tech companies made from aggregated user data.
Read the original article on Business InsiderREAD MORE ARTICLES ON
Popular Right Now
Popular Keywords
- India’s wearables market decline
- Vivo V40 Pro vs OnePlus 12R
- Nothing Phone (2a) Plus vs OnePlus Nord 4
- Upcoming smartphones launching in August
- Nothing Phone (2a) review
- Current Location in Google
- Hide Whatsapp Messages
- Phone is hacked or not
- Whatsapp Deleted Messages
- Download photos from Whatsapp
- Instagram Messages
- How to lock facebook profile
- Android 14
- Unfollowed on Instagram
Advertisement

