The Sad State Of American Inequality In 12 Charts
Income inequality in the US has gone up over the last 40 years:

Inequality varies geographically across the country:
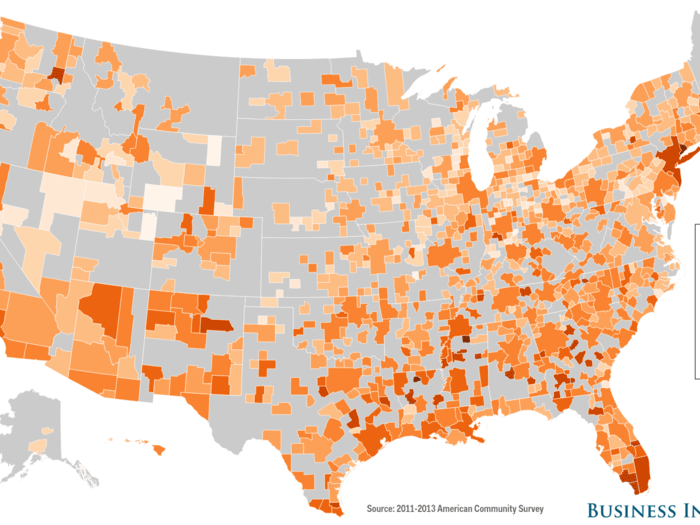
Gini indexes in metropolitan areas and areas around middle-sized towns range from a fairly egalitarian 0.36 in Juneau, AK to a highly unequal 0.55 in Ruston, LA. We recently made a list of the most unequal large metro areas based on US Census data.
America's high Gini index is rare among developed countries:
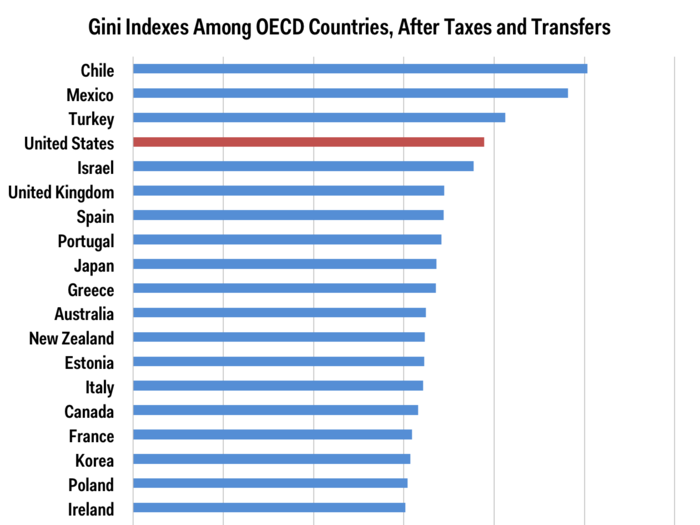
Among OECD countries, only Chile, Mexico, and Turkey have more inequality by this measure.
Another way to look at inequality is to consider how much of the national income goes to the top of the distribution. Here's the share of income for the top 10% in the US over the last century or so.
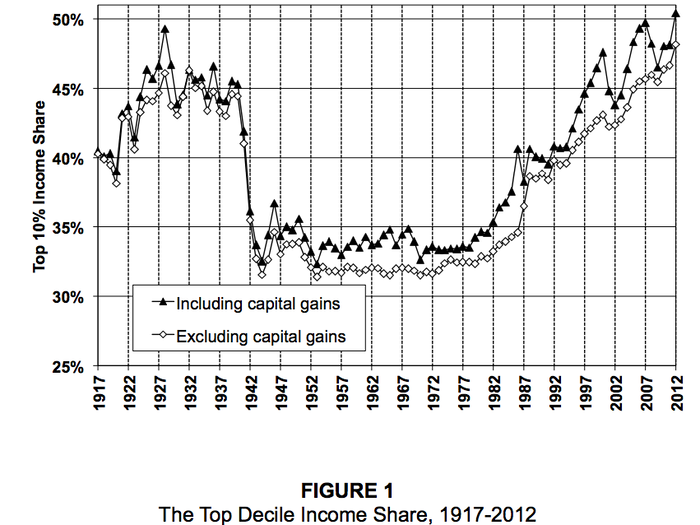
According to a 2013 paper by Berkeley economist Emmanuel Saez, at the start of the century through the roaring twenties, the top of the heap got an outsized share of income. After the New Deal and World War II, that share drops precipitously, in a period often referred to as the "Great Compression". From the early eighties to the present, that top income share has started to skyrocket back to where it was at the start of the twentieth century.
But just looking at the top 10% doesn't tell the whole story. Here's that group broken into smaller components:
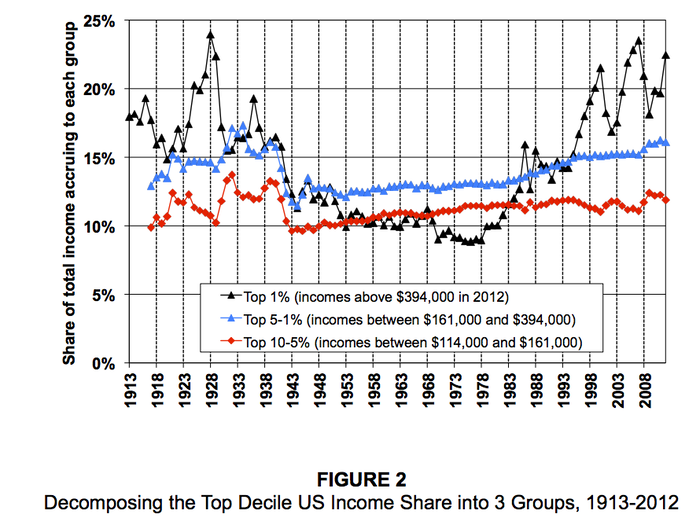
The top 1% is responsible for most of the top decile's gains, while the rest of the top 10% saw much more modest increases.
This is even starker when looking at the extreme top:
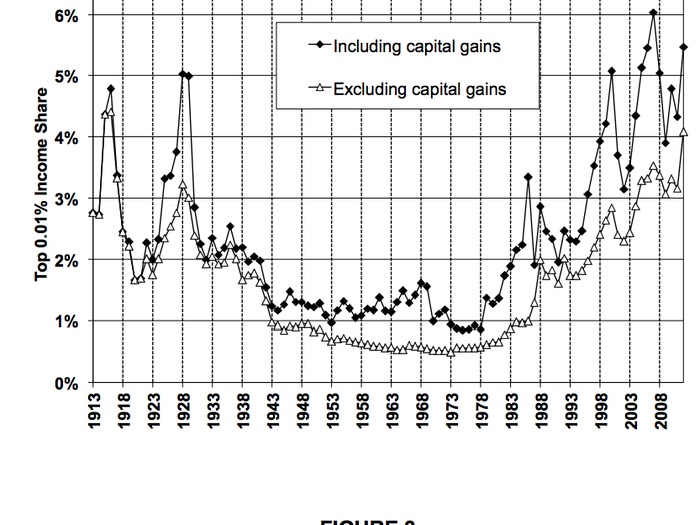
The top ten-thousandth of earners — the top 1% of the 1% — took in about 5.4% of total income in 2012.
In addition to seeing an ever larger share of income, the top 0.01% has also had their real incomes grow by over 600% over the last three decades, while real incomes for the bottom 90% have been stagnant:

The swings in inequality over the twentieth century are even more dramatic when looking at wealth, rather than income:
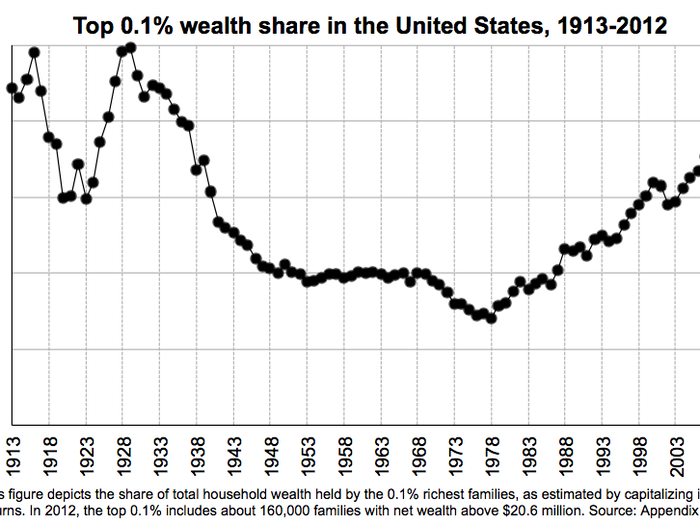
The wealth share of the top 0.1% has more than doubled since the 1980s, according to a recent study based on estimating wealth from income tax returns done by Emmanuel Saez and Gabriel Zucman.
One aspect of increasing wealth inequality is that the super-rich save much more of their income than the middle class:
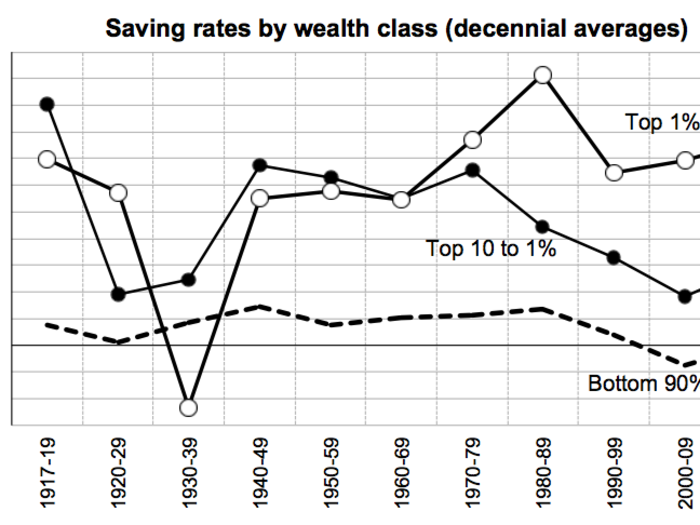
People in the bottom 90% frequently don't have enough extra income to keep saving. As Business Insider's Shane Ferro recently put it, "People need somewhere to live, and they have to keep up with increasing tuition if they want to go to college. Necessary fixed costs increased while incomes stagnated, so saving gave way to debt in order for people to maintain the same lifestyle they had in previous decades."
One interesting aspect of wealth inequality is that Americans vastly underestimate the degree of inequality:
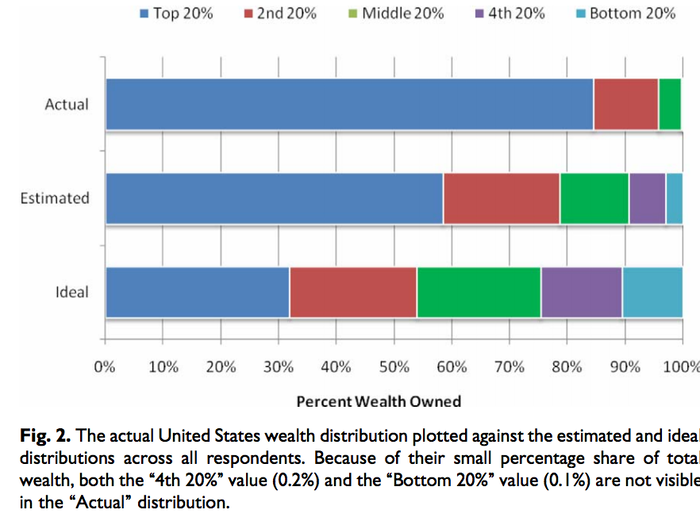
A 2010 survey showed that both Americans' ideal and estimated wealth distributions were far more equitable than the actual wealth distribution.
Another important part of looking at inequality is how easy or hard it is for people to move around the income distribution between generations:
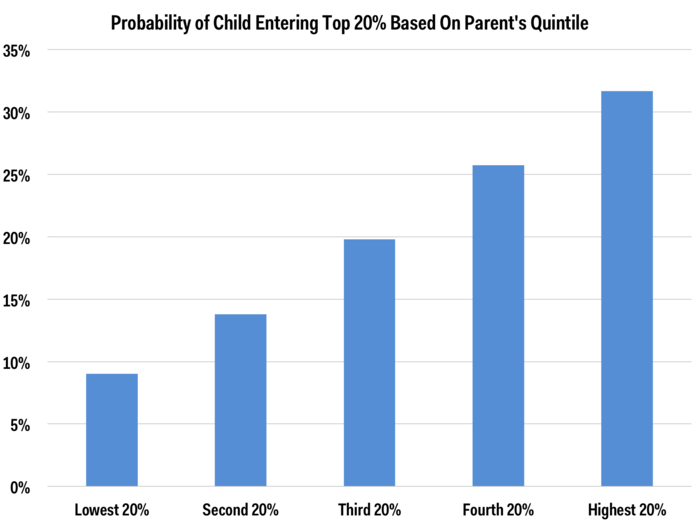
This chart, based on data from the Equality of Opportunity Project, shows that the higher up on the income ladder a parent is, the more likely their child will end up in the top part of the income distribution. A child whose parents are already in the top fifth is more than three times as likely to stay at the top than a child from the bottom fifth is to get there.
Intergenerational mobility varies highly across the United States:
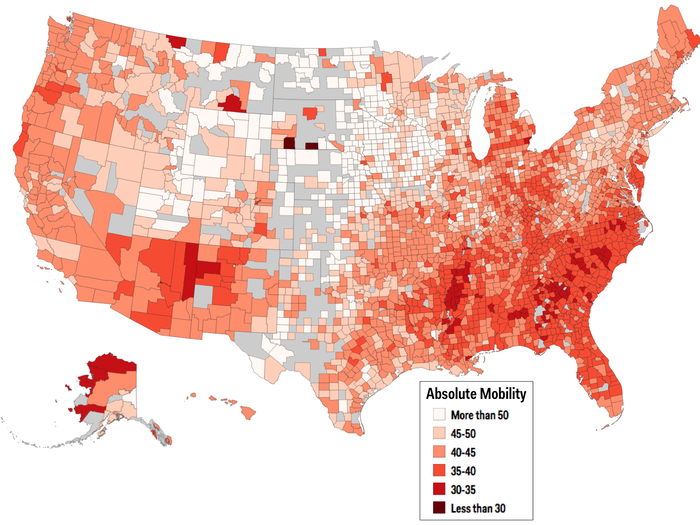
This map shows where a typical child starting in the middle of the bottom half of the income distribution will end up in the income rankings as an adult. Lighter counties have more intergenerational mobility; darker counties have more children ending up in the same part of the income distribution as their parents:
The Sad State Of American Inequality In 12 Charts


Popular Right Now
Popular Keywords
Advertisement