RANKED: The 50 US State Economies From Worst To Best
50. Mississippi

49. New Mexico

New Mexico has struggled to recover from the Great Recession, with labor conditions and demographics stagnant over the last few years. New Mexico had low scores on most of our metrics:
- The average annual wage in New Mexico was somewhat low, at $40,804.
- New Mexico's state government finances were in bad shape, with a 2012 deficit of $1.8 billion, which, on a per capita basis, is the 4th worst in the country.
- International exports made up a much smaller part of New Mexico's economy than for other states, with just $1,307 of exports per capita in 2013.
48: Arkansas

Arkansas is the home of Walmart, sitting proudly at the top of the Fortune 500 list. Unfortunately, Arkansas was among the ten worst states on three measures:
- Average annual wages were only $38,927 in 2013.
- Personal consumption expenditures were the second lowest in the country at $28,366.
- GDP per capita as a whole was just $39,111.
47: Maine

Maine faces demographic headwinds: only two states, Maine and West Virginia, had more deaths than births between 2012 and 2013. Maine struggled on a number of metrics:
- Maine was one of thirteen states to lose payroll jobs in July 2014, dropping 900 non-farm payrolls.
- Maine had a low GDP per capita, at $38,517.
- Average wages were also somewhat low, at $39,282.
46: South Carolina

South Carolina's largest private sector industries are professional and business services, retail trade, and manufacturing. Here's how South Carolina did on our variables:
- South Carolina lost 4,600 non-farm payroll jobs in July, the third worst loss in the country.
- Gross Domestic Product per capita was just $30,728, also the third lowest.
- The average annual wage was $39,800.
45: West Virginia
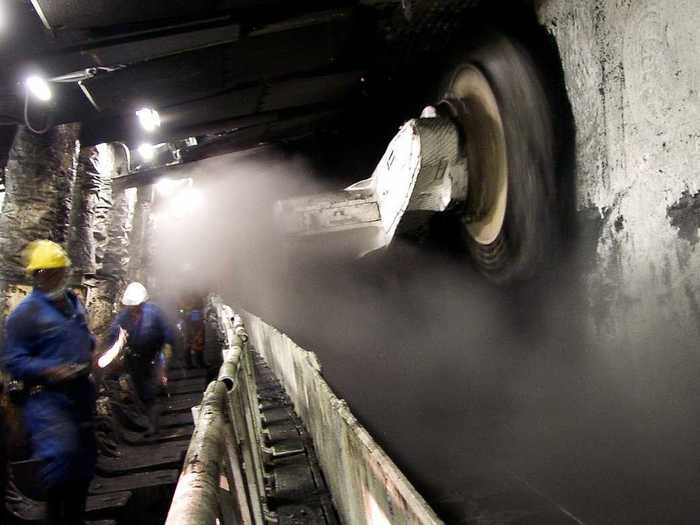
Coal is still a big part of West Virginia's economy. West Virginia faired poorly on a few of our metrics:
- West Virginia lost 2,900 jobs in July.
- Personal consumption per capita was just $30,642.
- Gross Domestic Product per capita as a whole was low, at $36,963.
44: Kentucky

Healthcare giant Humana and KFC, Taco Bell, and Pizza Hut owner Yum! Brands call Kentucky home. Here's how Kentucky measured up:
- Kentucky's 7.4% unemployment rate is still quite a bit higher than the rates of other states.
- The state's financial situation was suboptimal, with expenses exceeding revenues by about $6.7 billion in 2012.
- On the brighter side, exports per capita were among the best in the country at $5,771 per person, fueled by civilian aircraft and auto sales.
43: Nevada

After being one of the major centers of last decade's housing bubble and bust, Nevada is still feeling the effects of the crisis. Here's how we ranked Nevada:
- Nevada's unemployment rate of 7.7% is among the highest in the nation.
- Personal consumption, at $29,514 per capita, is quite a bit lower than in most other states.
- Despite this, Nevada's state finances were quite good, with a $305 per capita surplus in 2012.
42: Idaho

Idaho has had some difficulties in the last few years, including serious cuts to education funding by the state government. Here's Idaho's scores on our variables:
- Gross Domestic Product per capita was just $35,375, the second lowest among the states.
- Idaho's workers earn on average $36,859, also the second lowest in the country.
- On the other hand, Idaho's unemployment rate of 4.8% is much lower than average.
41: Hawaii

With a decline in tourism in the last few years, the Hawaiian economy has hit a bit of a roadblock. Hawaii had a mix of good and bad scores:
- Hawaii had the smallest value of exports per capita in the country, at just $426 per person.
- Personal consumption per capita was also quite low, at $30,160.
- However, Hawaii also had one of the lowest unemployment rates among the states, at just 4.4%.
40: Florida

The home of Disney World and the Kennedy Space Center has mixed economic figures. Here's how Florida ranked:
- Florida had a low GDP per capita of $38,384, much lower than the national figure of $49,642.
- Florida lost 1,600 jobs in July, one of only thirteen states to have negative job growth that month.
39: Georgia

Georgia's economy had some problems even before the crash, and they continue to struggle post-recession. Here's how Georgia fared on our measures:
- Georgians spent $31,219 per capita on personal consumption in 2012, somewhat below the national figure of $33,253.
- Georgia's unemployment rate of 7.8% was the second highest in the country.
- However, the other big indicator for labor market health looks somewhat better. Georgia added 9,500 jobs in July.
38: Oklahoma

Forbes ranked Oklahoma City as the seventh best place in the U.S. for business and careers. Here are Oklahoma's stats:
- Oklahoma's economy is less export driven than other countries, with just $1,797 in exports per capita.
- While Oklahoma lost 1,100 non-farm payroll jobs in July, its unemployment rate stays very low at 4.6%.
37: Alabama

Agriculture and forestry are a huge part of Alabama's economy, making up almost 40% of state GDP. Here's how we ranked Alabama:
- Per capita consumption was on the low end of the spectrum at $29,537.
- Overall GDP per capita was also low, at only $37,389, well below the national per capita GDP of $49,642.
- Alabama also had a higher than average unemployment rate of 7.0%.
36: Rhode Island

We've noted before that Rhode Island faces unique challenges in the 21st century. Here are some of Rhode Island's metrics:
- Rhode Island's 7.7% unemployment rate is among the worst in the country.
- Exports from Rhode Island are also soft, with just $2,057 per capita.
35: Ohio

Ohio may be poised for better economic times in the near future, with shale energy discoveries and a return of manufacturing to the U.S. Here's how Ohio measured up:
- Ohio had mostly middle of the road rankings. The July unemployment rate was 5.7%, a little below the national rate of 6.2%.
- Similarly, average annual wages were in the middle of the pack at $44,667, not too far below the national average of $49,804.
- However, what held Ohio back was the July jobs report: Ohio lost 12,400 jobs in July, the worst performance in the country.
34: Tennessee

An annual report on the state of Tennessee's economy by the Center for Business and Economic Research at the University of Tennessee projects that Tennessee's labor and housing markets "have been slow to heal" in the wake of the Great Recession. Here's where Tennessee's ranking comes from:
- Tennessee's unemployment rate was 7.1% in July, eighth highest among the states.
- Per capita personal consumption was a bit lower than average at $31,417.
- On the bright side, exports per capita were at $4,975, higher than average among the states.
33: Indiana

Life sciences, the auto industry, and energy are three of the biggest sectors in Indiana's economy. Here's Indiana's score:
- Indiana was one of the handful of states that lost jobs in July, losing 600 non-farm payrolls.
- Despite that, Indiana's unemployment rate of 5.9% was pretty close to the national rate of 6.2%.
- Indiana's exports per capita of $5,199 were higher than for most states, with pharmaceuticals being the biggest export by value from the state.
32: Arizona

The Economic and Business Research Center at the University of Arizona predicts in their second quarter 2014 economic outlook that "with federal fiscal drag expected to dissipate in the near term, the door is open for faster state growth. How fast that growth turns out to be will depend in part on the strength of the housing recovery." Here's how Arizona did on our variables:
- Gross Domestic Product per capita in Arizona was somewhat lower than in other states, at $39,526.
- The unemployment rate stayed higher than elsewhere at 7.0%.
- However, Arizona added 13,900 jobs in July, sixth best in the country.
31: Pennsylvania

The expansion of natural gas fracking in the Marcellus Shale formation has had mixed effects on Pennsylvania's economy and environment. Here's how Pennsylvania fared on our measures:
- Pennsylvania lost 700 jobs in July, one of thirteen states to do so.
- Pennsylvania's state finances were worse than elsewhere, with the state running an $8.8 billion deficit in 2012.
- Pennsylvania's average annual wage of $49,070 was just shy of the national average $49,804 and was higher than in most other states.
30: Missouri

Ten Fortune 500 companies are headquartered in Missouri, including chemical and agricultural giant Monsanto. Here's what's going on in Missouri:
- Per capita gross domestic product was $42,708, a bit below the national per capita GDP of $49,642.
- Missouri's unemployment rate of 6.5% is very much in the middle of the states, and just a bit higher than the national rate of 6.2%.
- Missouri saw strong job creation in July, adding 13,200 non-farm payroll jobs.
28 (tie): Montana

Montana is a big wide-open place and agriculture is still the state's largest industry. Here's how Montana scored on our variables:
- Average annual wages were just $37,575, the fourth lowest in the country.
- Similarly, per capita Gross Domestic Product was $39,250, well below the $49,642 per capita GDP of the United States as a whole.
- One bright spot is state finances. In 2012, Montana's government had a $665 million surplus.
28 (tie): Maryland

With its proximity to Washington, D.C., technology, communications, and defense are all key areas in Maryland's economy. Maryland was a mixed bag on our indicators:
- Maryland's mean annual wage was $54,055, sixth best among the states.
- Personal consumption was strong, at $40,980 per capita.
- However, Maryland lost 9,000 jobs in July, and the state government spent $5 billion more than it took in as revenue.
27: South Dakota

Agriculture and tourism are the two biggest industries in South Dakota. Here's the state's scorecard:
- South Dakota's July unemployment rate was down to 3.7%, the fourth lowest among the states.
- However, average annual wages in South Dakota were lower than in other states at $37,226.
26: Oregon

According to the Oregon state government, in the past, timber and agriculture were the biggest drivers of Oregon's economy. In more recent years the state's economy has come to look more like the overall national economy, with growth in manufacturing and services. Here's where Oregon stands:
- Oregon's GDP per capita was a solid $53,750 in 2013.
- Unfortunately, Oregon's unemployment rate was at 6.9%, higher than most other states.
- Oregon's per capita personal consumption expenditures of $35,762 was close to the national figure of $33,253.
25. Kansas

Kansas' economy is driven by agriculture and manufacturing — the state is a major producer of wheat, sorghum grains, wild hay and beef. Kansas is also a major producer of airplanes, which ads an annual economic impact of $7.1 billion — or $2,561 per capita. Here's how Kansas did in our variables:
- Kansas' average annual wage was $41,546.
- The unemployment rate was 4.9%, one of the lower numbers across the nation.
- And the GDP per capita was $45,665.
23. North Carolina [TIE]
![23. North Carolina [TIE]](https://staticbiassets.in/thumb/msid-42038914,width-700,height-525,imgsize-158378/23-north-carolina-tie.jpg)
North Carolina's economy "finally got moving"during the second half of 2013, according to a recent Wells Fargo report, because construction payrolls saw gains, and employment in manufacturing and government has "improved". Additionally, rapid growth is happening in North Carolina's business services sector. In our metrics...
- North Carolina added 15,800 jobs in July 2014 — the 5th highest in the nation.
- The 2013 average annual wage was $43,789.
- Unemployment was at 6.5%.
23. Wisconsin [TIE]
![23. Wisconsin [TIE]](https://staticbiassets.in/thumb/msid-42038921,width-700,height-525,imgsize-74790/23-wisconsin-tie.jpg)
In 2013, Wisconsin's economy "grew at a moderate pace". Manufacturing, agriculture, and healthcare drive Wisconsin's economy. Since 1910, Wisconsin has been the leading producer of cheese in the nation (mozzarella taking 33.4% of the market in 2013). In our metrics...
- Wisconsin's unemployment rate was 5.8%.
- The state added 2,900 jobs in July.
- The average annual wage is $42,775.
22. Utah

Major industries driving Utah's economy include tour sim, aerospace and defense, and health care. In 2013, Utah's employment grew faster than the U.S. average. Here's how the state did in our ranking:
- Utah's unemployment rate was 3.6%, the second best in the nation.
- The average annual wage was $41,786.
- The state was highly ranked for exports, which nearly $5,554 per capita.
21. Colorado

Colorado's economy is ahead of expectations for 2014, partially because of strong performances by the energy and tourism industries. Here's how the state did in our metrics:
- Colorado's unemployment was at 5.3%.
- The average annual wage was at $50,864.
- The GDP per capita was at $51,955.6.
20. Nebraska

Nebraska has developed agriculture and manufacturing sectors. On the agriculture end, the state produces sorghum, corn, wheat, cattle, and hogs. On the manufacturing end, the state produces electronic and auto components, as well as oil and gas. The state's 2014 economic outlook is expected to be "not as strong as 2013". In our metrics...
- Nebraska has an unemployment rate of 3.6% — the second lowest in the nation tied with Utah.
- Average annual wage was $39,968.
- However, 500 jobs were lost in July.
19. Louisiana

Louisiana's economy is driven by mineral production (especially oil and has), petroleum refining, and chemical and petrochemical production. Just like other energy-rich states, Louisiana's economy expanded in 2013 (by 5.4%). In our measurements...
- Louisiana led the states in exports with $13,696 per capita.
- Unemployment was at 5.4%.
- And the 2013 GDP per capita was $47,996.85.
18. Iowa

Iowa's economy saw a "prosperous" year in 2013 following a downward trend in unemployment rate. Additionally, Iowa's financial sector alone added 1,700 jobs in 2013, while manufacturing and construction added 6,700 jobs. In our metrics...
- Iowa's unemployment rate was at 4.5%.
- And the 2013 average annual wage was $41,103.
- The GDP per capita was at $48,702.
17. Michigan

According to a report by JP Morgan Chase, Michigan's economy is expected to gradually accelerate into 2014 and 2015. Following a "revival" of various manufacturing industries, Michigan is finally seeing some economic stability. According to our measures...
- Michigan's unemployment was a 7.7% — one of the highest in the nation.
- But the state added 17,900 jobs in July.
- The average annual wage was $47,119.
16. Minnesota

Minnesota is a "consistently solid performer, with a diverse economy and an unemployment rate that has typically remained well below the national average", according to a report by Wells Fargo. In our ranking...
- Minnesota had a low unemployment rate at 4.5%.
- The average annual wage was relatively high at $50,115.
- But July saw a drop in 4,200 jobs.
15. Virginia
In 2013, Virginia's economy "continued to limp along as federal fiscal tightening restrained growth in this government-dependent state", according to a Wells Fargo report. Virginia has a diverse economy with agriculture, coal, cement, an rail transport industries. According to our numbers...
- The state saw an unemployment rate of 5.4%.
- The state added 13,300 jobs in July.
- And the average annual wage was at $51,923.
14. New Hampshire

New Hampshire was less affected by the Great Recession than other states. Additionally, non-farm jobs did better in New Hampshire than in the rest of the nation. In our data...
- New Hampshire's unemployment rate was 4.4%.
- The average annual wage was $48,969.
- And the GDP per capita was $48,447.
13. New Jersey

New Jersey's economy is forecasted to grow by 1.5 percent in 2014, and eventually by 3.4 percent by 2015. In the last few years, the economy struggled because it was more affected by the housing crisis, and because of Hurricane Sandy. In our data...
- New Jersey had the 4th highest wages overall with $59,451 as the average annual wage of 2013.
- The state added 5,700 jobs in July.
- And unemployment stood at 6.5%.
12. Illinois

Illinois is expected to pick up speed in 2014 and 2015, but job gains are "likely" to lag behind the national economy levels, according to a JP Morgan Chase report. Here's how the state did in our measurements...
- Illinois had a relatively high unemployment rate of 6.8%.
- But added 10,300 jobs in July.
- The average annual wage was at $52,588.
11. California

California's economy is so huge that is surpasses both Russia and Italy's economies. The state has numerous, large industrial sectors, and saw a recent art boom in Los Angeles. Plus, of course, all the tech industries in the San Francisco area. In our metrics...
- California added 27,700 jobs in July — the second highest number in the nation.
- However, it's unemployment rate was also high, at 7.4%.
- The average annual wage for a Californian in 2013 was $57,121.
10. Wyoming

Wyoming's economy is expected to accelerate in 2014, according to a Wells Fargo report. And the unemployment trends indicate that the economy is rebounding. According to our data...
- Unemployment was low at 4.4% and the average annual wage was at $44,977.
- The GDP/capita was the third highest in the nation at $67,858.
- 200 jobs were added in July.
9. Vermont

Vermont has seen the greatest growth in New England since the Great Recession. Vermont also continues to lead the U.S. maple syrup industry. In our data...
- Vermont has a low unemployment rate of 3.7% and an average annual wage of $42,050.
- Vermont added 1,100 jobs in July.
- And had the 4th highest number for exports with $6,425 per capita.
8. Delaware

Delaware's governor, Jack Markell, signed a balanced Fiscal Year 2015 budget focusing on increasing economic opportunity for all Delawareans in July. Healthcare and professional business services are seeing "increasingly strong" futures," while the labor force and real wages are seeing "decreasingly moderate" futures. In our data...
- The 2013 average annual wage at Delaware was $52,103.
- The unemployment rate was 6.2%.
- And the state added 1,500 jobs in July.
7. Connecticut

Average annual wages of Connecticut workers increased by 0.2% in the last year. However, forecasts suggest that the state will see slower growth in 2014 and 2015. Here's how Connecticut did according to our numbers:
- The state had the second highest average annual wage at $62,283.
- Connecticut also had a high GDP/capita at $65,070.
- However, unemployment was relatively high at 6.6%.
6. Massachusetts

Massachusetts passed an $80 million economic development act that will improve training for Massachusetts's high-growth industries, and will provide "incentives to create jobs and stimulate the economy." The state's economy grew by $424.4 billion from 2009 to 2013. According to our data...
- Massachusetts was number one in per capita consumption at $47,305.
- Additionally, the state had the third highest average annual wage at $61,794.
- Massachusetts added 13,800 jobs in July.
5. Washington

Washington has many major companies including Microsoft, Starbucks, and Amazon. The state's job market is forecasted to expand, and the IT sector will be an important economic driver, according to a JP Morgan report. Our data shows that...
- Washington's unemployment rate is 5.6%.
- The average annual wage is at $53,009.
- The state added 7,300 jobs in July.
4. Alaska

Recently, big oil companies lucked out, as they will continue to enjoy favorable taxed in Alaska. However, Alaska's oil has been so depleted that the state's crude oil production is now fourth in the nation. According to our measures...
- Alaska had the highest GDP/capita at $70,113.
- The annual wage was relatively high at $51,568.
- But the state lost 400 jobs in July.
3. New York

New York State's economy is also expected to speed up in the upcoming year, according to a JP Morgan Chase report. There have been a "slightly elevated level" of layoffs, which the report states is a reflection of the "shifting ground under the financial sector". Here's how New York did in our measures:
- New York had the highest average annual wages in the nation at $63,085.
- The state added 15,900 jobs in July.
- The unemployment rate was at 6.6%.
2. Texas

Texas' economy continued to expand, especially in the oil and gas, and construction industries. Manufacturing and cuts in federal spending "contributed to the state's job growth slowdown". According to our data...
- Texas added the most amount of jobs — with a total of 46,600.
- The average annual wage was relatively high at $51,187.
- Exports were also high at $10,567 per capita.
1. North Dakota

North Dakota's oil boom sped up the economy in the last few years — and the trend is expected to continue because of the "robust demand of energy". Here's how North Dakota did in our measures...
- North Dakota had the lowest unemployment rate at 2.8%.
- The state had the second highest GDP/capita rate at $68,804.
- The average annual wage was $47,779.
RANKED: The 50 US State Economies From Worst To Best

Popular Right Now
Advertisement