12 Basic Shortcuts That Will Make You An Excel Guru And Add Hours To Your Life
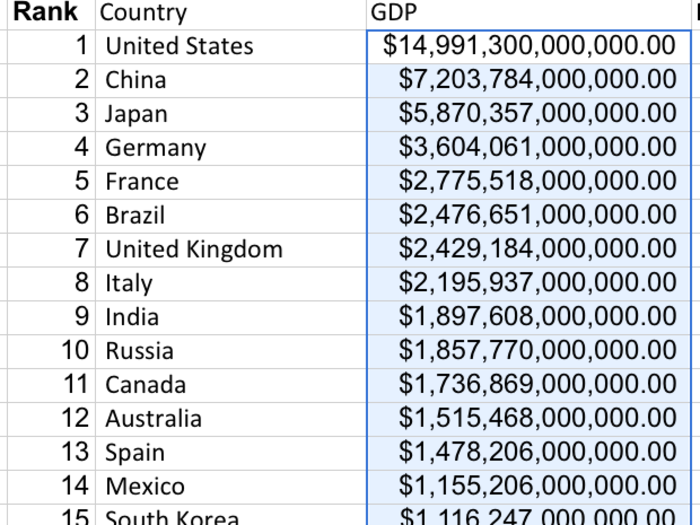
Let's say you have some ugly raw data that needs formatting ...

Ctrl + Shift + $ makes the number format into currency, with commas at the thousands and two decimal places
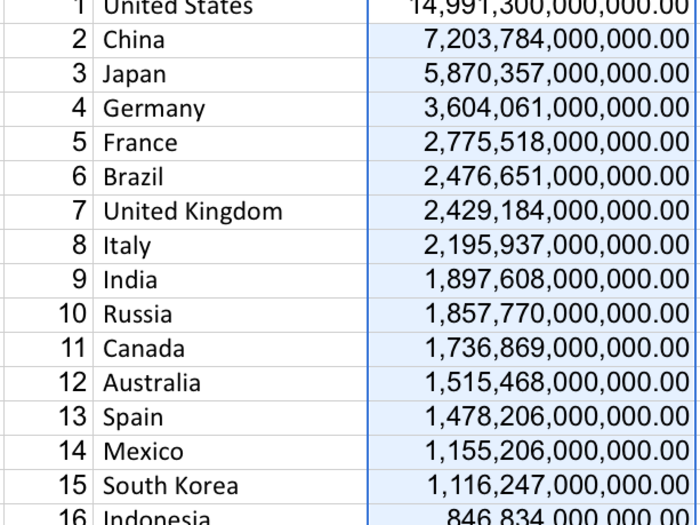
Control + Shift + ! automatically formats them into a number with two decimal places and commas
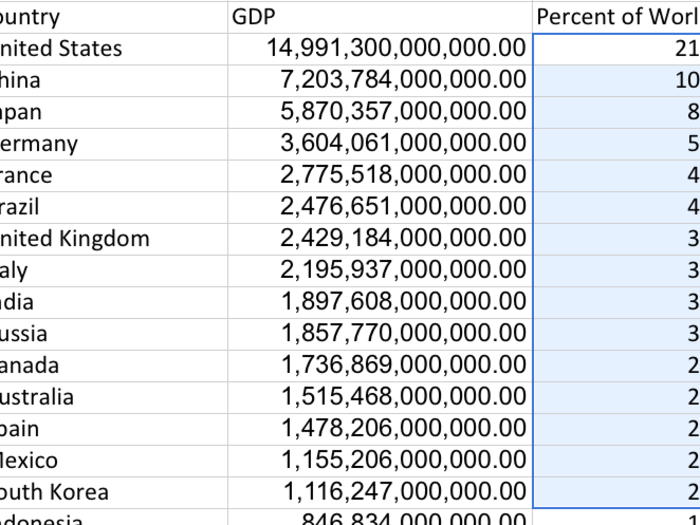
Control + Shift + % makes the format into percent.
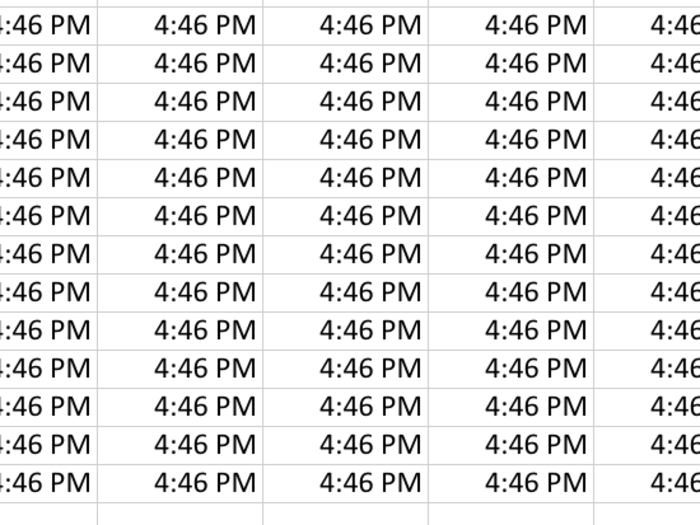
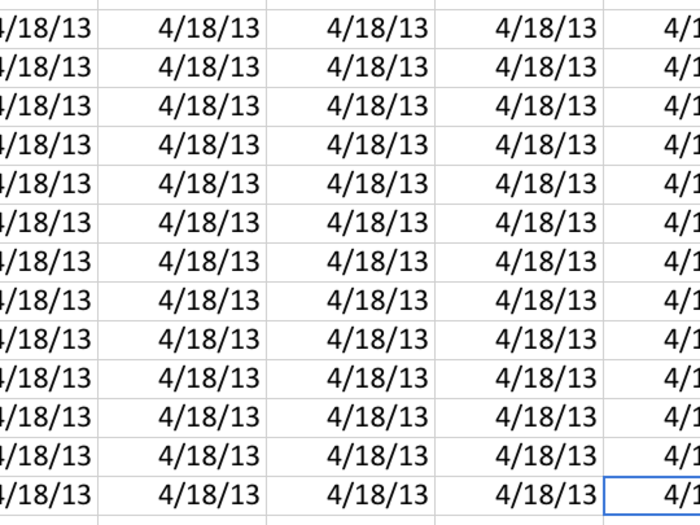
Control + Shift + : (colon) posts the current time into a cell.
On the same token, Control + ; (semicolon) posts the current date into a cell.
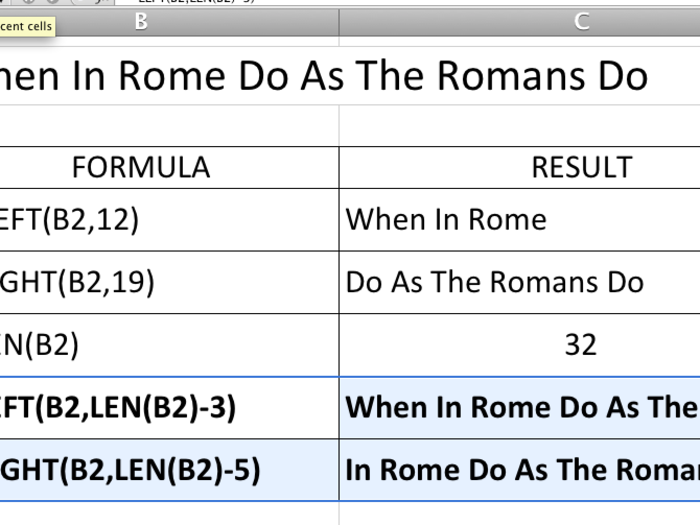
There are also a few basic functions which are used to edit text
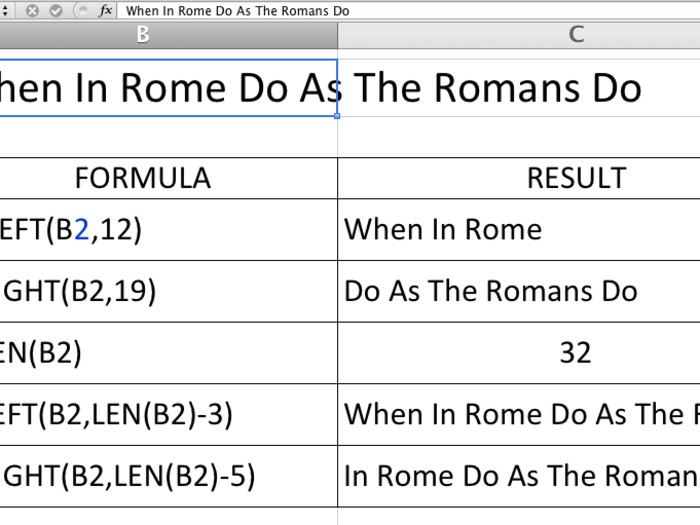
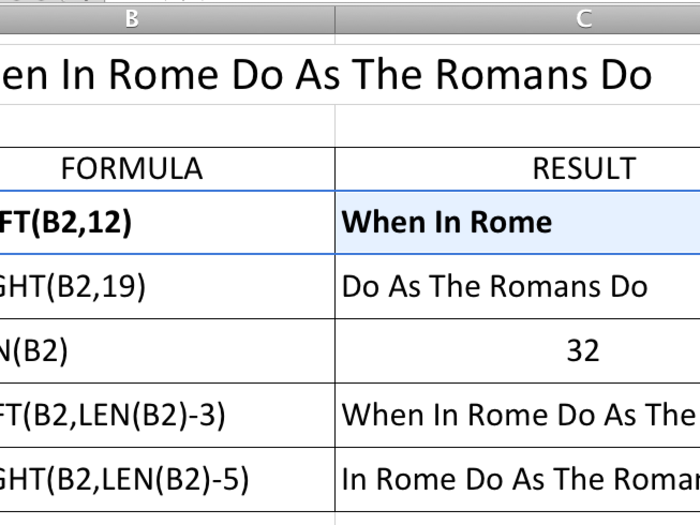
For example, =LEFT(B2,12) outputs the 12 leftmost characters from the string in box B2
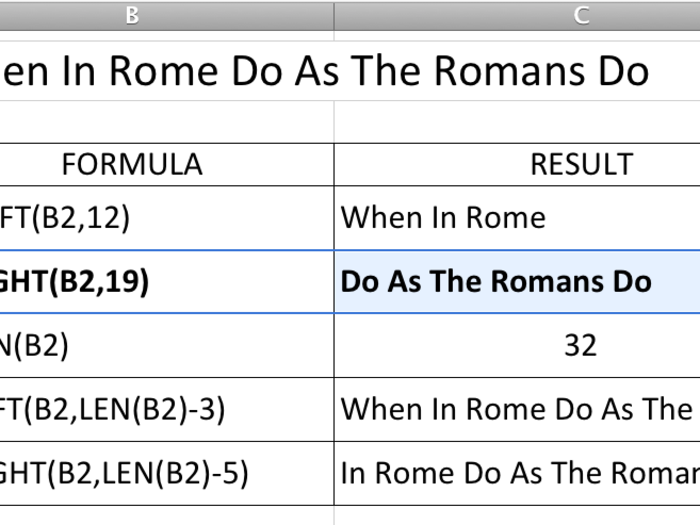
On the other hand, =RIGHT(B2,19) outputs the 19 rightmost characters from the string in box B2
The function =LEN(B2) is really helpful. It spits out the number of characters in B2
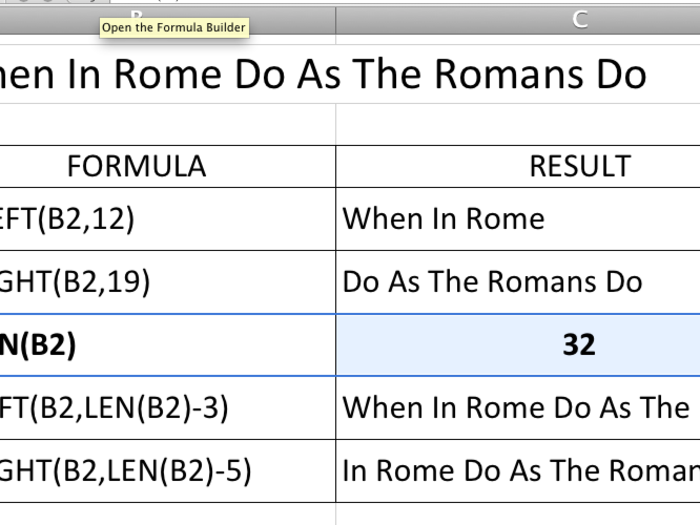
All three of these are most powerful when used in concert together.
VLOOKUP is one of the more powerful functions in excel. It's the kind of function that you'll never hear of until you desperately need it, at which point it will save you hours.
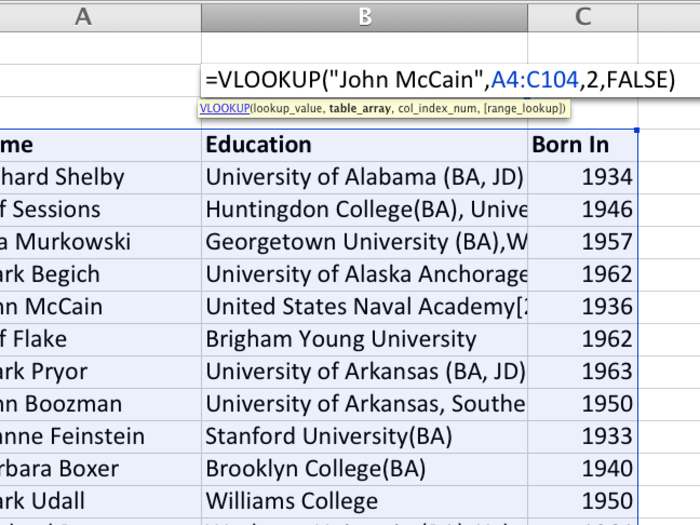
Right now we're looking to find out what John McCain's education was from a list of 100 Senators. So, we type in "John McCain" into the first term.

Next, we select the array that we're interested in, which is A4:C104 here.
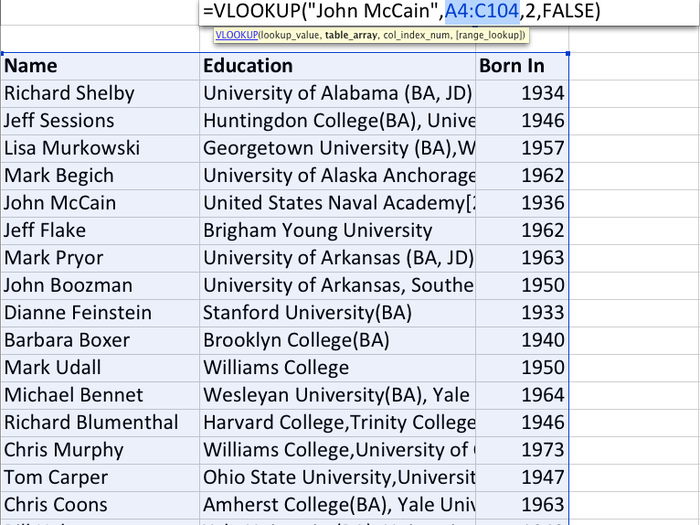
VLOOKUP searches for the first term in the first column of that array. The "2" in the third term says to return the answer in the second column of the selected array once VLOOKUP finds "John McCain" in the first.
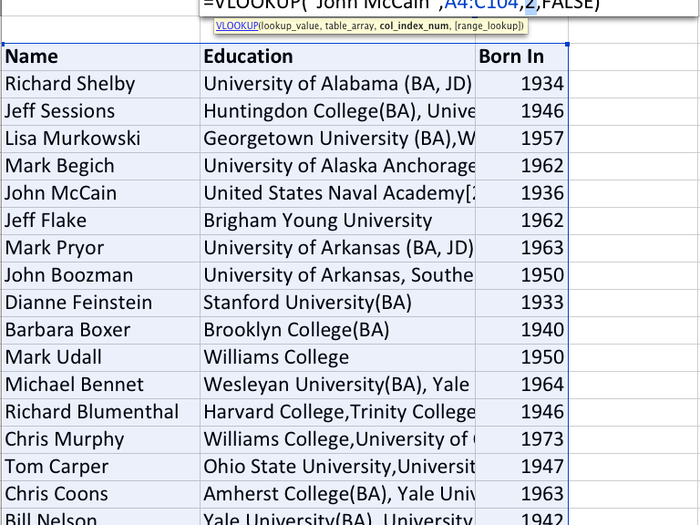
Then, "FALSE" tells VLOOKUP that it doesn't need to be an exact match. This is necessary if the list is unsorted.
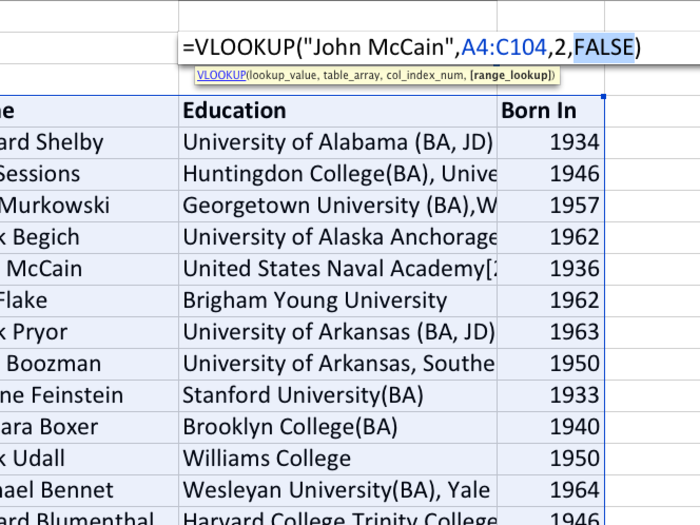
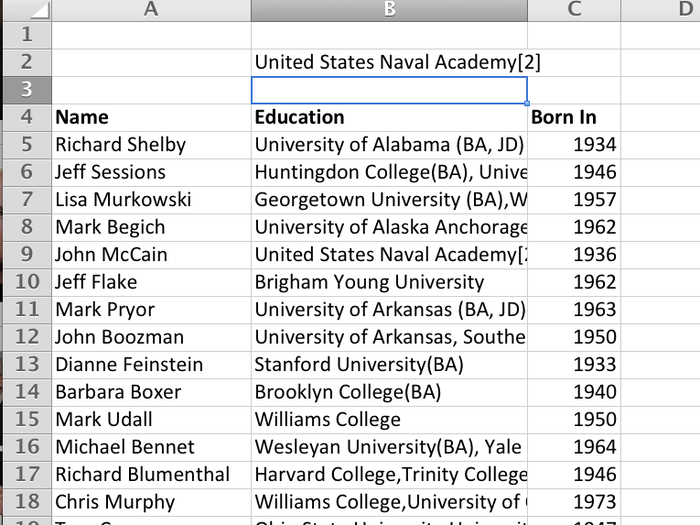
So, VLOOKUP finds "John McCain" in column 1, then returns the value on the same row in column 2 of the array.
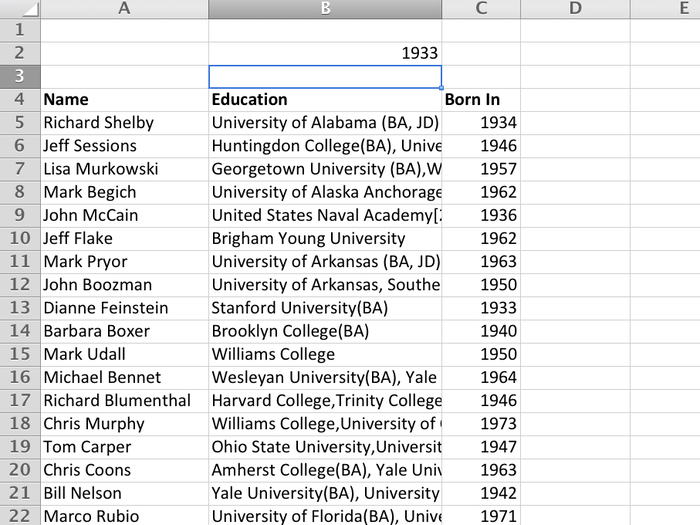
So in this example we're trying to find what year "Dianne Feinstein" was born — data in column 3.
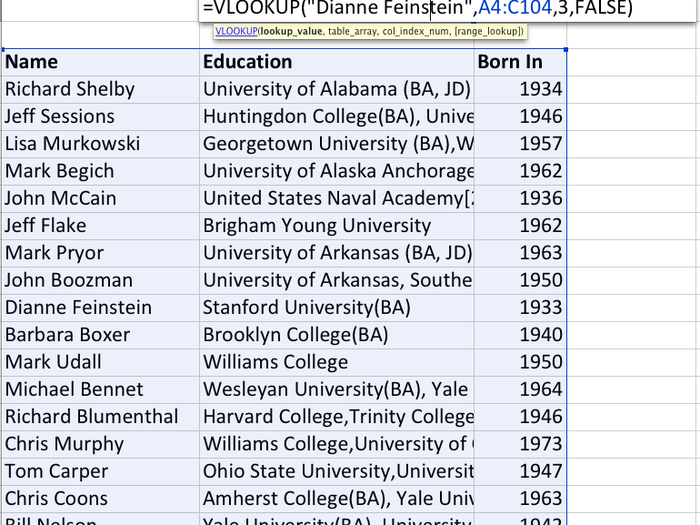
And it returns 1933, Dianne Feinstein's birth year.
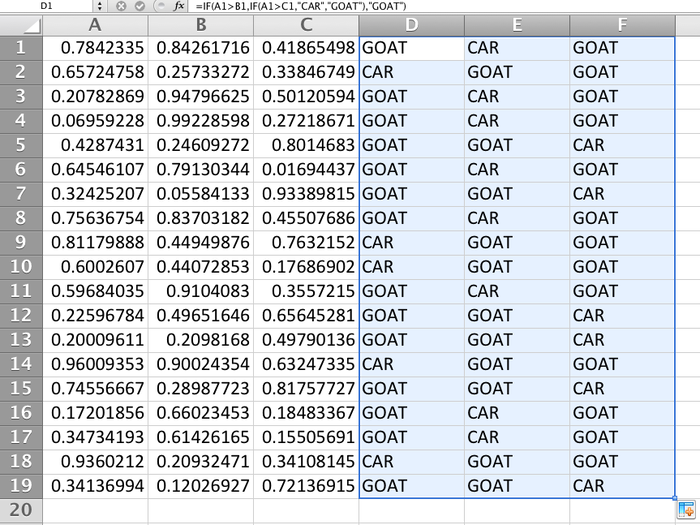
The rand() function generates a pseudorandom number between Zero and One.
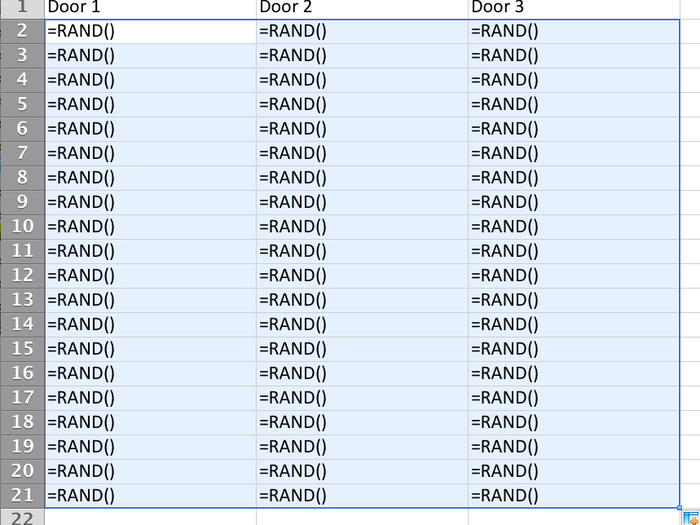
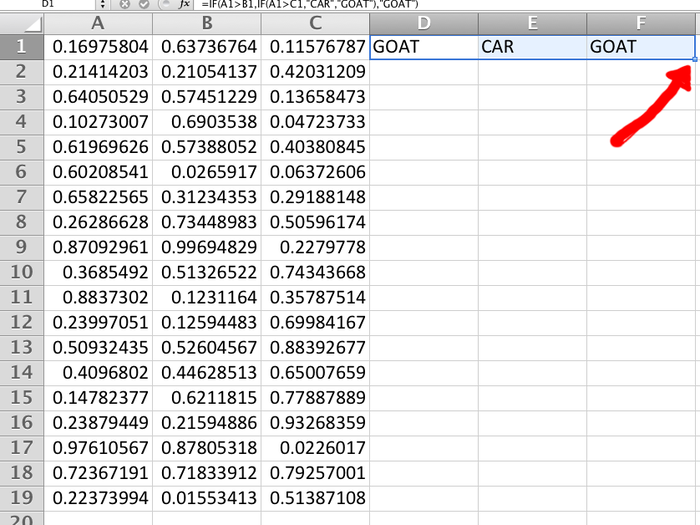
This is excellent for generating simulations, like a Monty Hall trial.
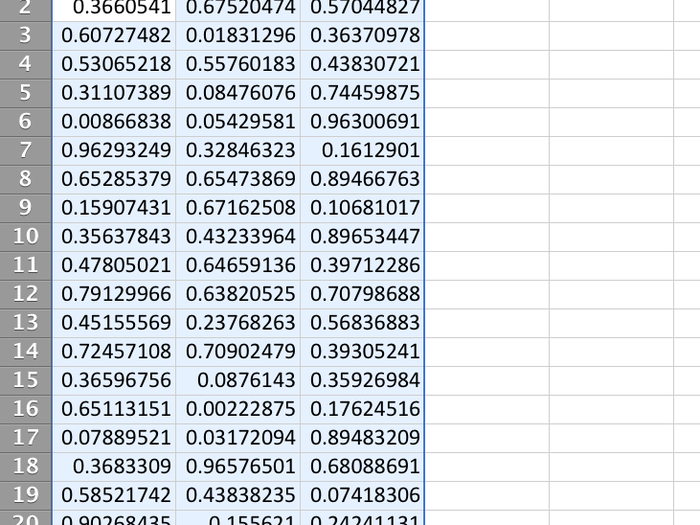
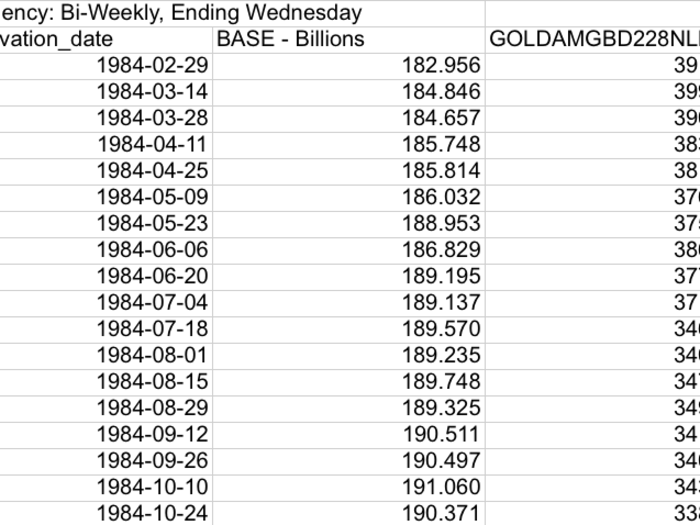
Let's say we fill out a row of formulas, and want to fill it in all the way down. We can just double click on the square in the bottom right corner of the highlighted section...
...and it'll fill in through the rest of the file. This is very handy when the file is massive.
Finally, the LINEST() function is also very useful. Here, we're going to run a linear regression to see if there's a relationship between the Fed's monetary base (in billions) and the price of gold.
The output of this function is an array. So, select a two by five section. Type in =LINEST. First select your x-values.
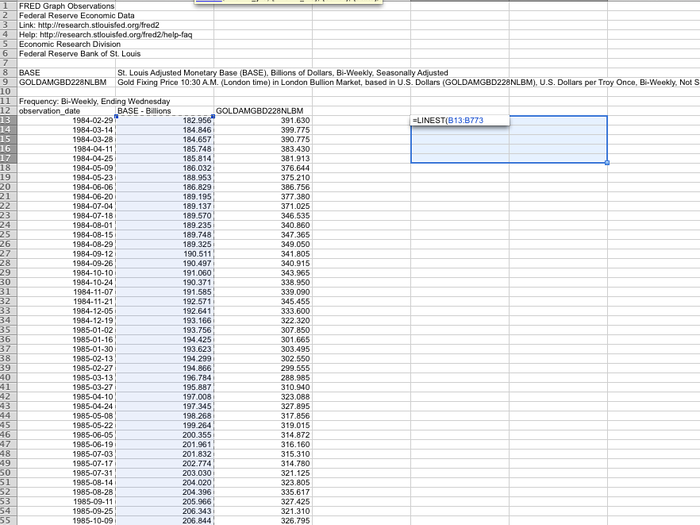
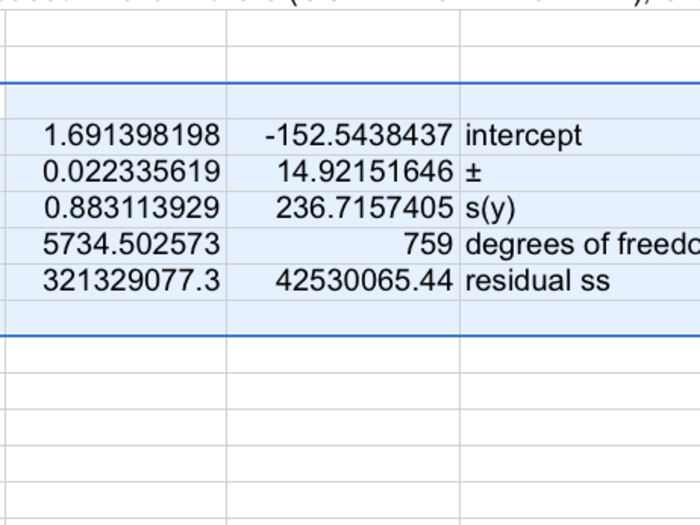
Then select your y-values. then, type in "TRUE" and "TRUE," indicating you want a y=mx+b output and the error bars listed. Now, since this is an array function, hit either Command-Enter (on Mac) or CTRL+SHIFT+ENTER (on PC)

This tells Excel that you want it treated as an array function. Here's what the output of the 2 by 5 array looks like. The reasonably high r-Squared shows that there is a potential correlation between the two. The slope tells us that generally, for every $1 the price of gold grows, there's $1.7 billion in growth in the monetary base.
12 Basic Shortcuts That Will Make You An Excel Guru And Add Hours To Your Life


Popular Right Now
Popular Keywords
Advertisement