- Home
- slideshows
- miscellaneous
- WELLS FARGO: Warren Buffett might like these 9 stocks right now
WELLS FARGO: Warren Buffett might like these 9 stocks right now
Altria

Foot Locker
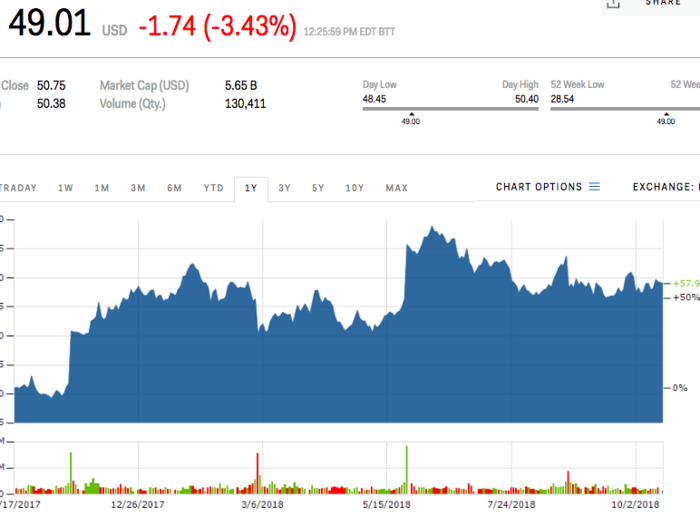
Ticker: (FL)
Sector: Retail
5-Year Average ROE: 19.2%
5-Year Average ROIC: 18.2%
D/E versus Industry D/E: 5% vs. 19.5%
5-year average pretax PM versus 5-year average industry PM: 10.6% vs. 6.1%
Current P/E versus Industry P/E: 11 vs. 18.6
Current P/B versus Industry P/B: 2.3 vs. 3.2
Current P/CF versus Industry P/CF: 6.0 vs. 8.7
Market Cap: $5.71 billion
Source: Wells Fargo
Micron Technology
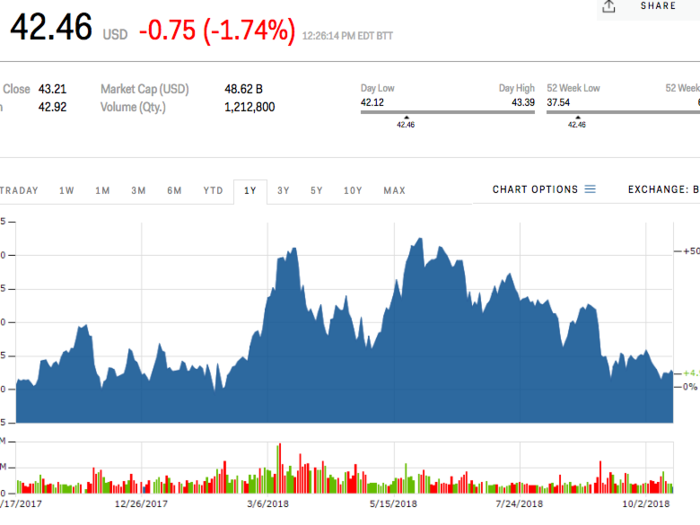
Ticker: (MU)
Sector: Technology
5-Year Average ROE: 28.4%
5-Year Average ROIC: 19%
D/E versus Industry D/E: 11.7% vs. 43.9%
5-year average pretax PM versus 5-year average industry PM: 15.1% vs. 9.6%
Current P/E versus Industry P/E: 4.0 vs. 22.2
Current P/B versus Industry P/B: 1.5 vs. 4.6
Current P/CF versus Industry P/CF: 2.8 vs. 18.2
Market Cap: $49.26 billion
Source: Wells Fargo
EQT Midstream Partners
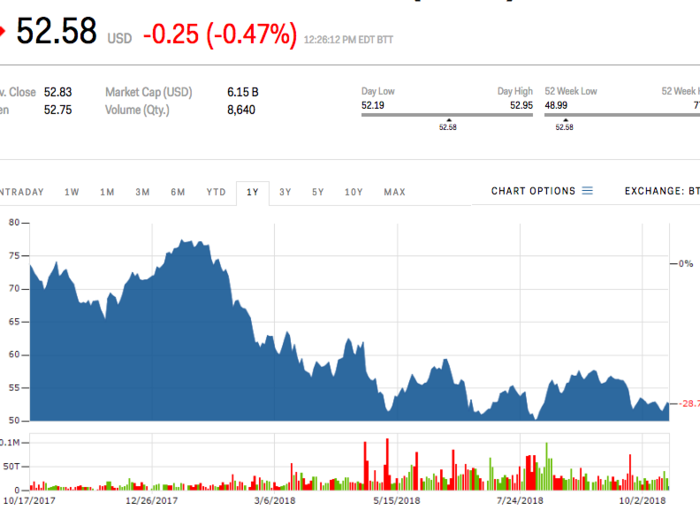
Ticker: (EQM)
Sector: Energy
5-Year Average ROE: 29.4%
5-Year Average ROIC: 18.5%
D/E versus Industry D/E: 139.4% vs. 216.6%
5-year average pretax PM versus 5-year average industry PM: 66.4% vs. 23.8%
Current P/E versus Industry P/E: 10.4 vs. 18.1
Current P/B versus Industry P/B: 1.8 vs. 3.1
Current P/CF versus Industry P/CF: 5.4 vs. 7.9
Market Cap: $6.2 billion
Source: Wells Fargo
Franklin Resources
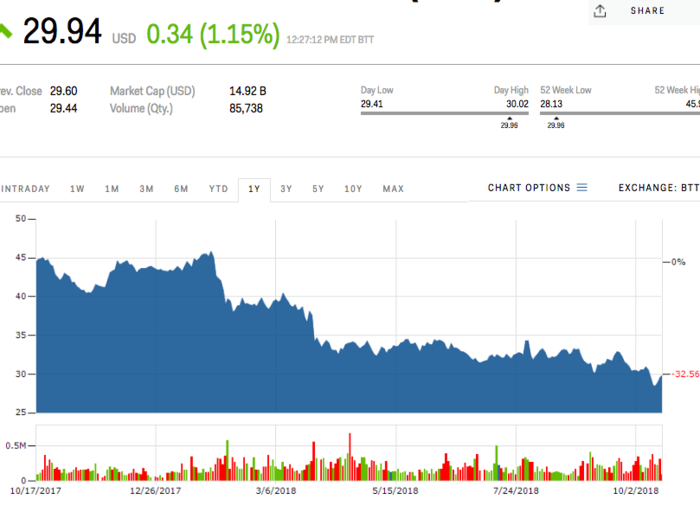
Ticker: (BEN)
Sector: Financials
5-Year Average ROE: 18%
5-Year Average ROIC: 15%
D/E versus Industry D/E: 7.4% vs. 164.2%
5-year average pretax PM versus 5-year average industry PM: 38.8% vs. 31.1%
Current P/E versus Industry P/E: 9.1 vs. 12.2
Current P/B versus Industry P/B: 1.5 vs. 3.4
Current P/CF versus Industry P/CF: 9.2 vs. 12.1
Market Cap: $15.04 billion
Source: Wells Fargo
Michael Kors Holdings
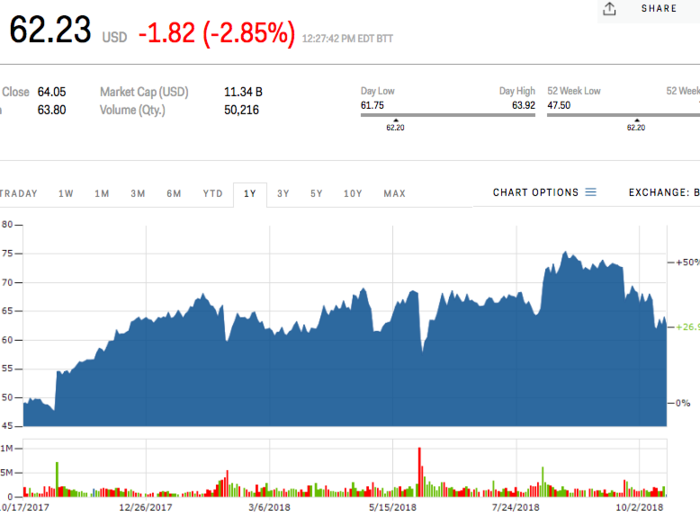
Ticker: (KORS)
Sector: Retail
5-Year Average ROE: 38.6%
5-Year Average ROIC: 37%
D/E versus Industry D/E: 27.2% vs. 61.2%
5-year average pretax PM versus 5-year average industry PM: 23% vs. 10.2%
Current P/E versus Industry P/E: 12.6 vs. 18.6
Current P/B versus Industry P/B: 4.7 vs. 4.3
Current P/CF versus Industry P/CF: 8.9 vs. 14.7
Market Cap: $9.50 billion
Source: Wells Fargo
Regeneron Pharmaceuticals
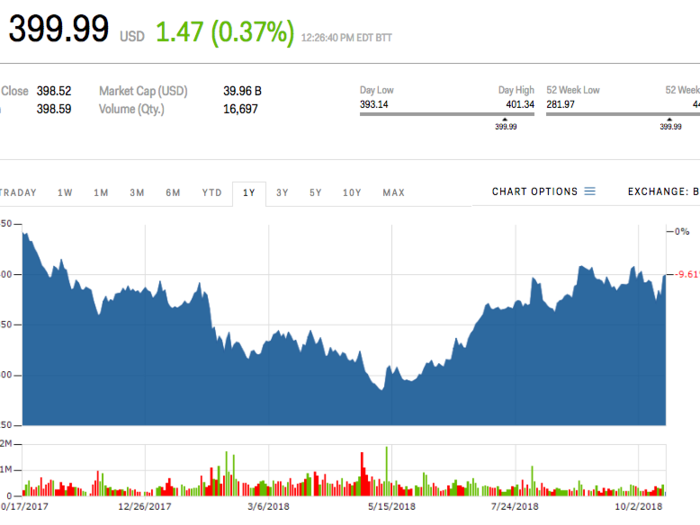
Ticker: (REGN)
Sector: Pharmaceuticals
5-Year Average ROE: 21.5%
5-Year Average ROIC: 18.3%
D/E versus Industry D/E: 9.8% vs. 57.1%
5-year average pretax PM versus 5-year average industry PM: 30.8% vs. 19.7%
Current P/E versus Industry P/E: 18.9 vs. 25.3
Current P/B versus Industry P/B: 5.8 vs. 6.2
Current P/CF versus Industry P/CF: 20.7 vs. 26.8
Market Cap: $40.78 billion
Source: Wells Fargo
Urban Outfitters
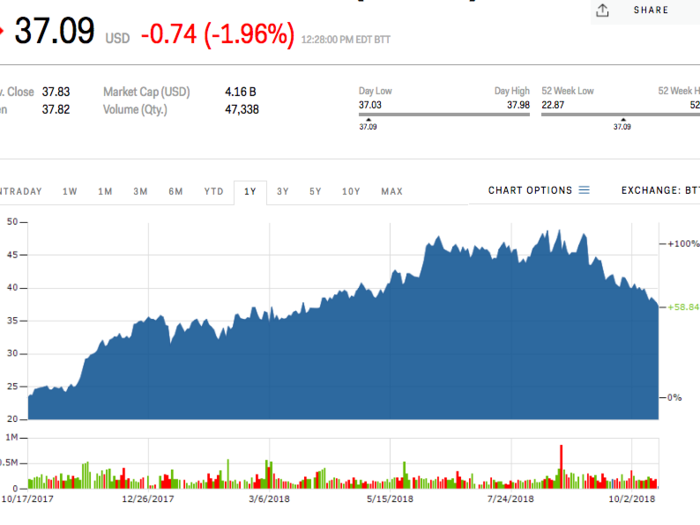
Ticker: (URBN)
Sector: Retail
5-Year Average ROE: 15.6%
5-Year Average ROIC: 15.2%
D/E versus Industry D/E:0% vs. 19.5%
5-year average pretax PM versus 5-year average industry PM: 10.3% vs. 6.1%
Current P/E versus Industry P/E: 14.5 vs. 18.6
Current P/B versus Industry P/B: 2.9 vs. 3.2
Current P/CF versus Industry P/CF: 10.5 vs. 8.7
Market Cap: $4.21 billion
Source: Wells Fargo
Bed Bath & Beyond
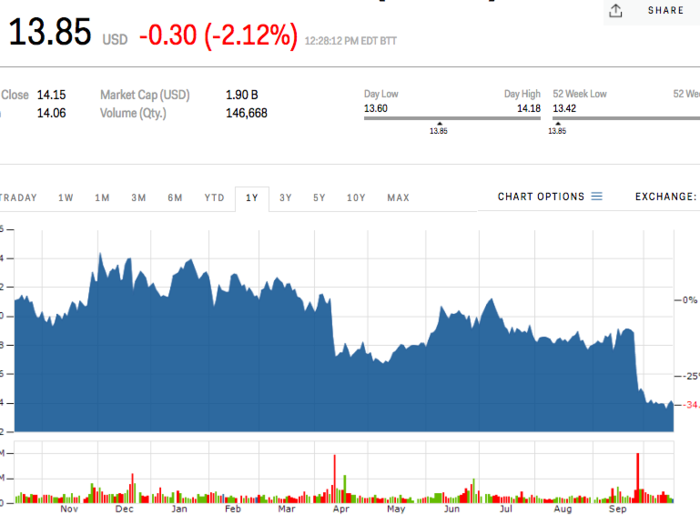
Ticker: (BBBY)
5-Year Average ROE: 25.4%
5-Year Average ROIC: 18.6%
D/E versus Industry D/E: 51.4% vs. 112.7%
5-year average pretax PM versus 5-year average industry PM: 10.4% vs. 6.6%
Current P/E versus Industry P/E: 6.7 vs. 15.1
Current P/B versus Industry P/B: 0.6 vs. 5
Current P/CF versus Industry P/CF: 1.6 vs. 9.6
Market Cap: $1.87 billion
Source: Wells Fargo
Popular Right Now
Popular Keywords
Advertisement