- Home
- slideshows
- miscellaneous
- The economy of every state and DC, ranked from worst to best
The economy of every state and DC, ranked from worst to best
51. Mississippi

50. Alaska

Alaska's November 2018 unemployment rate of 6.3% was the highest among the 50 states and DC, and its 0.2% decline in the number of non-farm payroll jobs between November 2017 and November 2018 was the second-worst.
49. West Virginia

West Virginia's November 2018 unemployment rate of 5.2% was the third-highest among the states and DC, and its Q2 2018 per capita GDP of $42,816 was the third-lowest.
48. New Mexico
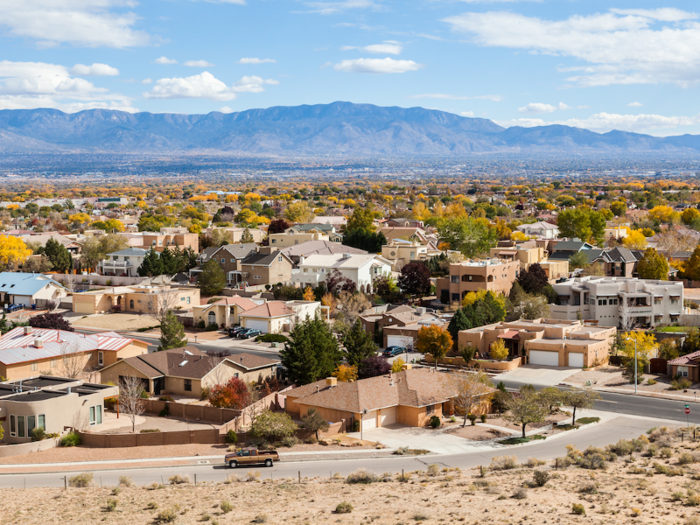
New Mexico's Q2 2018 GDP growth rate of 2.7% and its November 2018 average weekly wage of $751 were both the second-lowest among the states and DC.
47. Kentucky

Kentucky's non-farm payroll job growth rate of 0.9% between November 2017 and November 2018 was the fifth-lowest among the states and DC, and its November 2018 average weekly wage of $786 was sixth-lowest.
46. Rhode Island

Rhode Island's Q2 2018 GDP growth rate of 2.8% was tied for third-lowest among the states and DC, and its average weekly wage growth rate of 0.9% between November 2017 and November 2018 was tenth-lowest.
45. Indiana

The average weekly wage declined 0.2% in Indiana between November 2017 and November 2018, the sixth-worst rate among the states and DC. Indiana's non-farm payroll job growth rate of 1.0% was the seventh-lowest.
44. Vermont

The number of non-farm payroll jobs declined 0.4% between November 2017 and November 2018, making Vermont one of only two states with a negative job growth rate. Despite that, Vermont's November 2018 unemployment rate of 2.7% was the fifth-lowest among the states and DC.
43. Wisconsin

Wisconsin's Q2 2018 GDP growth rate of 2.8% was tied for third-lowest among the states and DC, and its average weekly wage growth rate of 0.5% between November 2017 and November 2018 was the ninth-lowest.
Wisconsin fared much worse than they did in our last ranking, falling 24 places from 19th in that quarter.
42. Delaware

Delaware's Q2 2018 GDP per capita of $77,673 was the fourth-highest among the states and DC, but its GDP growth rate of 2.5% that quarter was the lowest in the country.
41. Maine

Maine's non-farm payroll job growth rate of 1.0% between November 2017 and November 2018 was the eighth-lowest among the states and DC, and its average weekly wage of $829 in November 2018 was the tenth-lowest.
40. Maryland
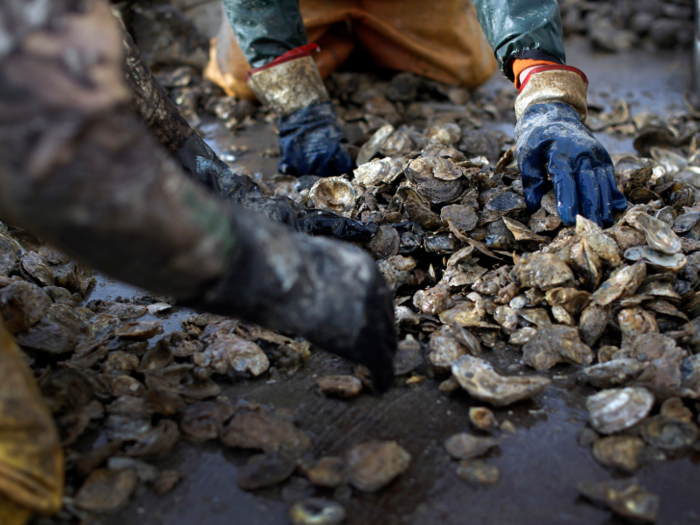
Maryland's average weekly wage of $993 in November 2018 was the ninth-highest among the states and DC, but that average wage declined 2.0% between November 2017 and November 2018, the second-lowest rate in the country.
Maryland fell 18 places from 22nd-best since our last ranking of the state economies.
39. Nebraska
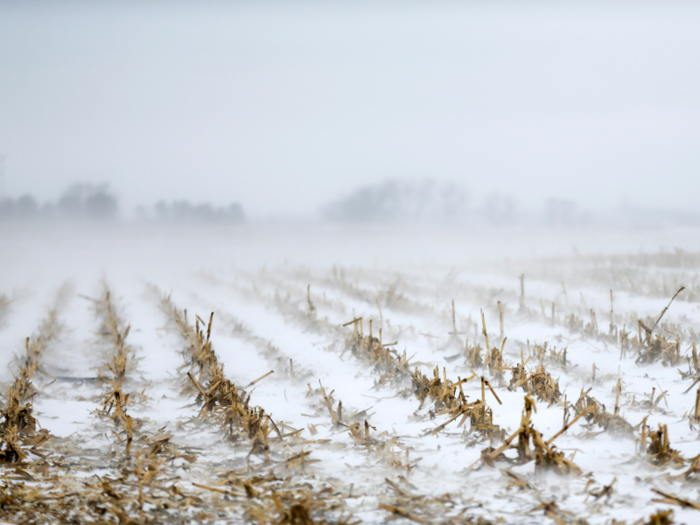
While Nebraska's November 2018 unemployment rate of 2.8% was tied for sixth-lowest among the states and DC, the state's average weekly wage declined by 1.3% between November 2017 and November 2018, making it one of six states with negative wage growth.
38. Idaho

Idaho's Q2 2018 per capita GDP of $44,374 was the fourth-lowest among the states and DC, while its GDP growth rate of 3.0% that quarter was the fifth-lowest.
37. Louisiana
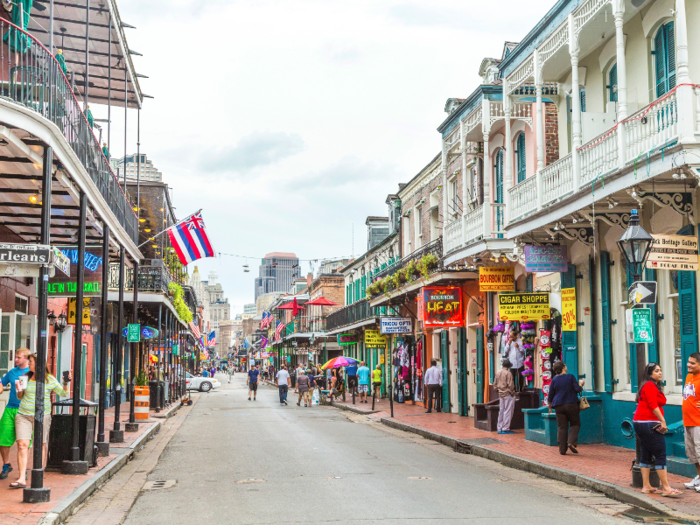
Louisiana's November 2018 unemployment rate of 5.0% was the fourth-highest among the states and DC, but its average weekly wage growth rate of 5.2% between November 2017 and November 2018 was the sixth-best.
36. South Carolina

South Carolina's Q2 2018 GDP per capita of $45,819 was the sixth-lowest among the states and DC, and its GDP growth rate of 3.2% that quarter was ninth-lowest.
35. Pennsylvania

Pennsylvania's Q2 2018 GDP growth rate of 3.6% was a bit below the average rate among the states and DC of 3.8%, while its wage growth rate of 3.8% between November 2017 and November 2018 was a bit above the average rate of 3.0%.
34. Ohio

Ohio's 4.6% unemployment rate in November 2018 was tied for seventh-highest in the country, while its non-farm payroll job growth rate of 2.1% between November 2017 and November 2018 was a little above the average rate of 1.7% among the states and DC.
33. Illinois
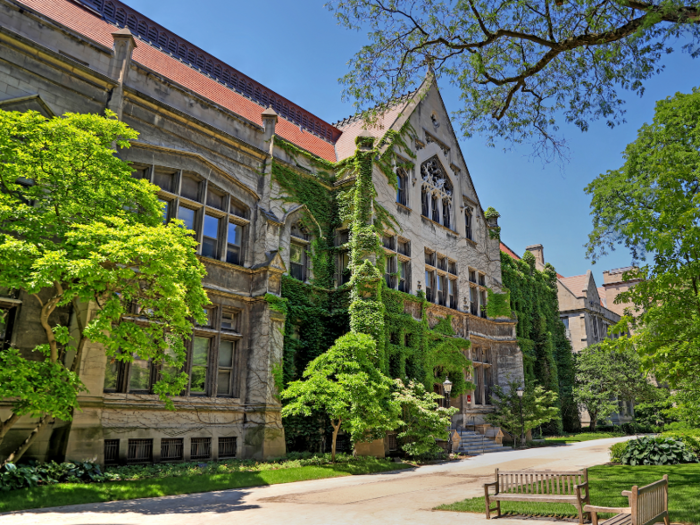
Illinois' non-farm payroll job growth rate of 0.9% between November 2017 and November 2018 was the sixth-lowest in the country, while its Q2 per capita GDP of $67,104 was somewhat above the average among the states and DC of $61,816.
32. Alabama

Alabama's Q2 2018 per capita GDP of $45,341 was the fifth-lowest in the country, and its non-farm payroll job growth rate of 1.7% between November 2017 and November 2018 matched the average rate among the states and DC.
31. Arkansas

Arkansas' Q2 2018 per capita GDP of $42,590 was the second-lowest among the states and DC, but its average weekly wage growth rate of 5.0% between November 2017 and November 2018 was the seventh-highest.
Arkansas fared much better than they did in our previous ranking of the state economies, moving up 18 places from 49th.
30. Iowa
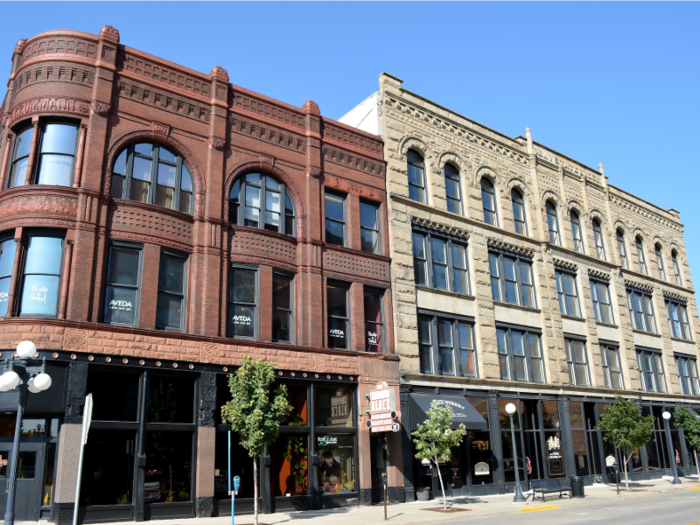
Iowa's November 2018 unemployment rate of 2.4% was tied for lowest in the country, while its average weekly wage of $834 in that month was below the average of $908 among the states and DC.
Iowa fell 20 places from 10th best in our previous ranking of the state economies.
29. North Carolina

North Carolina's Q2 2018 GDP growth rate of 3.4% was tied for eleventh-lowest among the states and DC, while its non-farm payroll job growth rate of 2.3% between November 2017 and November 2018 was the tenth-highest.
North Carolina fell 16 places from 13th-best in our previous ranking of the state economies.
28. New Jersey

New Jersey's average weekly wage of $1,021 in November 2018 was the seventh-highest among the states and DC, while its Q2 2018 GDP per capita of $69,603 was eleventh-highest.
27. Arizona

Arizona's non-farm payroll job growth rate of 3.6% between November 2017 and November 2018 was the second-highest among the states and DC, while its November 2018 unemployment rate of 4.7% was tied for fifth-highest.
26. Oregon

Oregon's non-farm payroll job growth rate of 2.5% between November 2017 and November 2018 was the ninth-highest in the country, while its average weekly wage of $901 in November 2018 was close to the average among the states and DC of $908.
25. Tennessee

Tennessee's average weekly wage growth rate of 4.9% between November 2017 and November 2018 was the ninth-highest in the country, while its November 2018 unemployment rate of 3.6% was just below the average rate of 3.7% among the states and DC.
24. South Dakota

South Dakota's average weekly wage of $768 in November 2018 was the fourth-lowest among the states and DC, but its unemployment rate of 3.0% that month was tied for tenth-lowest.
23. Connecticut
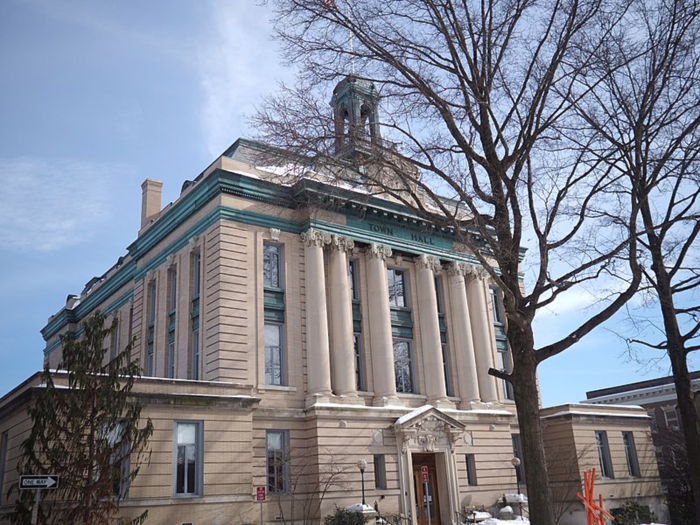
Connecticut's Q2 2018 GDP per capita of $76,012 was the fifth-highest among the states and DC, and its November 2018 average weekly wage of $1,087 was the fourth-highest.
22. Utah

Utah's non-farm payroll job growth rate of 2.9% between November 2017 and November 2018 was the sixth-highest among the states and DC, but its 0.3% decline in wages over that year was the fifth-lowest rate.
Utah fell 16 places from 6th-best in our previous ranking of the state economies.
21. New York

New York's Q2 2018 per capita GDP of $84,420 was the second-highest among the states and DC, and its average weekly wage of $1,044 in November 2018 was the sixth-highest.
20. Montana
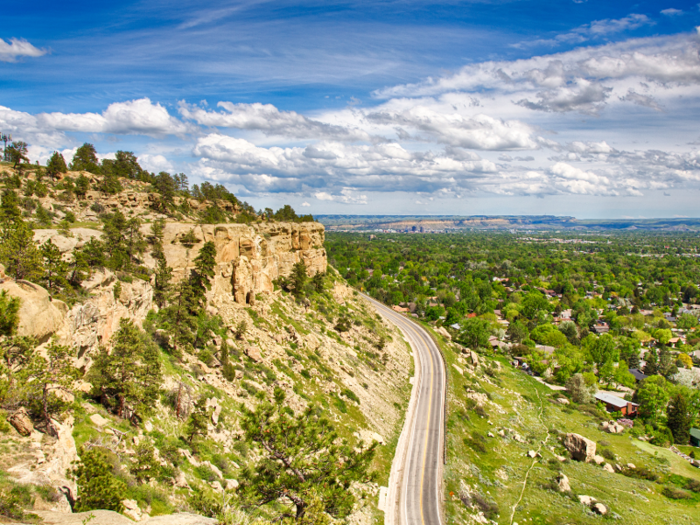
Montana's Q2 2018 GDP growth rate of 4.9% was tied for fifth-highest among the states and DC, but its average weekly wage of $801 in November 2018 was the seventh-lowest.
19. Missouri
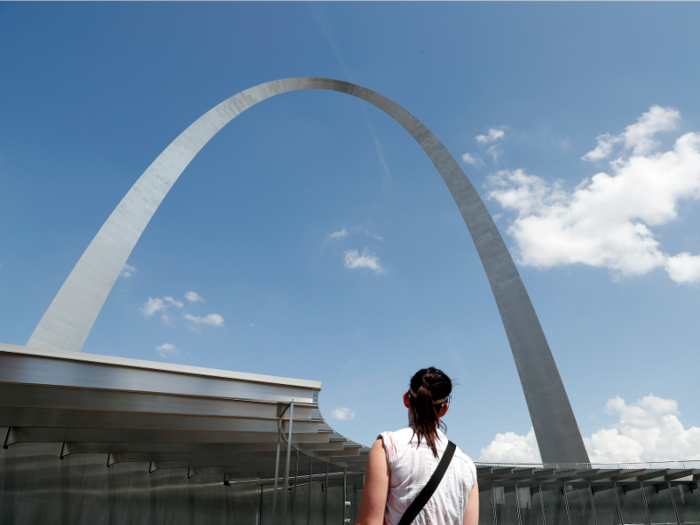
Missouri's November 2018 unemployment rate of 3.0% was tied for tenth-lowest among the states and DC, and its Q2 2018 GDP growth rate of 5.1% was the third-highest.
18. Hawaii

Hawaii's November 2018 unemployment rate of 2.4% was tied for lowest among the states and DC, but its Q2 2018 GDP growth rate of 3.1% was tied for sixth-lowest.
17. Georgia
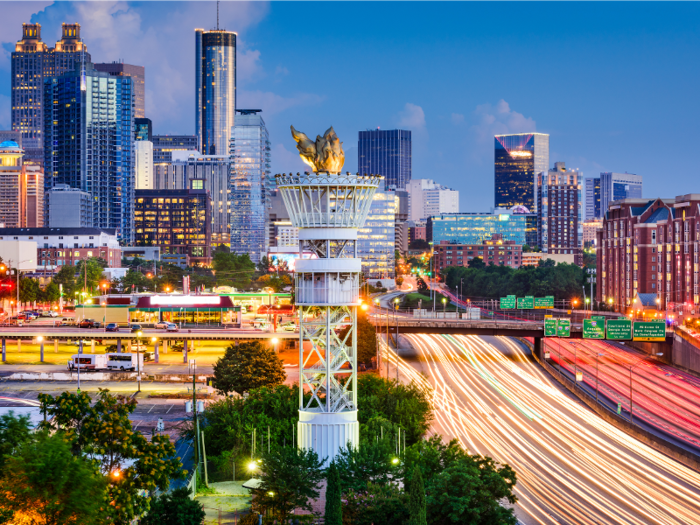
Georgia's non-farm payroll job growth rate of 2.2% between November 2017 and November 2018 was the twelfth-highest in the country, while its Q2 2018 GDP growth rate of 3.9% was just above the average rate of 3.8% among the states and DC.
Georgia moved up 18 places from 35th-best in our previous ranking of the state economies.
16. California

California's Q2 2018 per capita GDP of $74,243 was the seventh-highest among the states and DC, and its average weekly wage of $1,066 in November 2018 was the fifth-highest.
15. Michigan
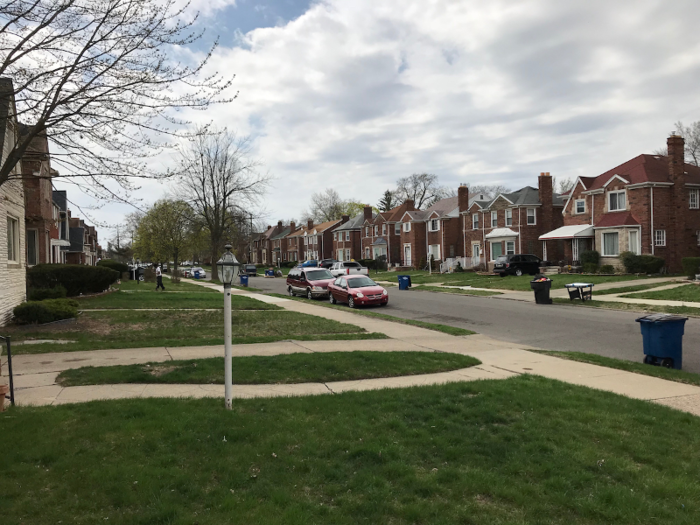
Michigan's Q2 2018 GDP growth rate of 5.4% was the second-highest in the country, and its average weekly wage growth rate of 4.0% between November 2017 and November 2018 was above the average rate of 3.0% among the states and DC.
14. Kansas
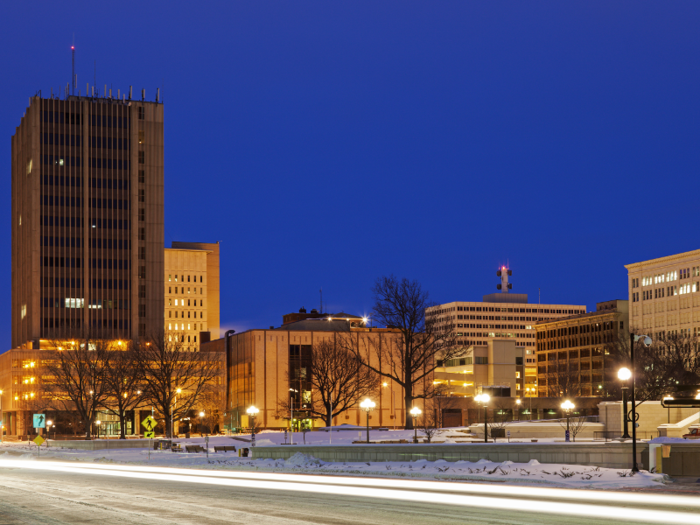
Kansas' Q2 2018 GDP growth rate of 4.7% was the seventh-highest in the country, and its November 2018 unemployment rate of 3.2% was below the average rate among the states and DC of 3.7%.
Kansas moved up 17 places since our previous ranking of the state economies, from 31st-best to its current 14th.
13. Florida

Florida's non-farm payroll job growth rate of 2.8% was the seventh-highest among the states and DC, and its Q2 2018 GDP growth rate of 4.5% was ninth-highest.
12. New Hampshire

New Hampshire's November 2018 unemployment rate of 2.5% was the third-lowest among the states and DC, but its 0.5% decline in average weekly wages between November 2017 and November 2018 was the fourth-lowest wage growth rate.
New Hampshire moved up a whopping 25 places, from 37th-best, since our previous state economy ranking.
11. Oklahoma

Oklahoma's average weekly wage growth rate of 7.2% between November 2017 and November 2018 was the third-highest in the country, but its Q2 2018 GDP per capita of $50,771 was below the average of $61,816 among the states and DC.
10. North Dakota

North Dakota's 2.8% unemployment rate in November 2018 was tied for sixth-lowest, and its Q2 2018 per capita GDP of $73,048 was eighth-highest.
North Dakota improved quite a bit from our previous ranking of the state economies, when it came in 34th place.
9. Minnesota

Minnesota's Q2 2018 GDP growth rate of 5.0% was the fourth-highest among the states and DC, and its average weekly wage of $985 was the tenth-highest.
8. Virginia
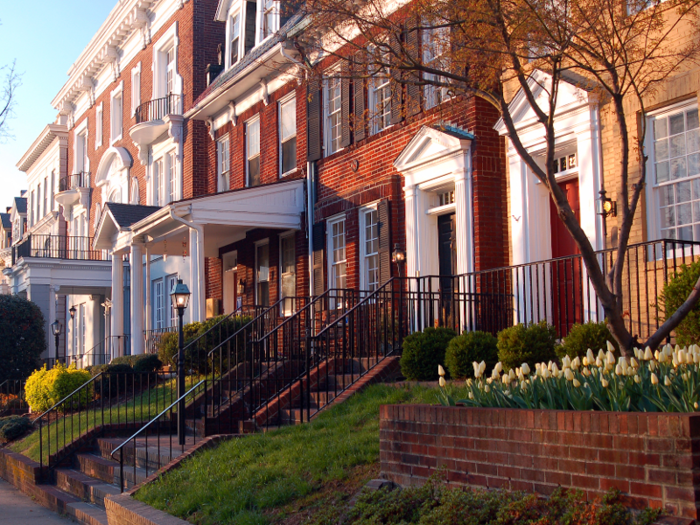
Virginia's 2.8% unemployment rate in November 2018 was tied for sixth-lowest among the states and DC, and its average weekly wage of $980 that month was the eleventh-highest.
7. Massachusetts
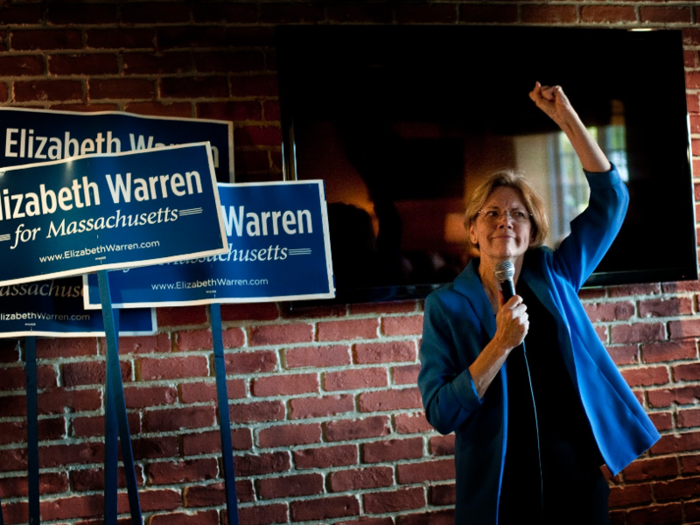
Massachusetts' November 2018 average weekly wage of $1,123 and Q2 2018 per capita GDP of $82,989 were both the third-highest among the states and DC.
6. Nevada

Nevada's average weekly wage growth rate of 7.4% between November 2017 and November 2018 was the second-highest among the states and DC, and its non-farm payroll job growth rate of 3.8% was the highest.
5. Washington
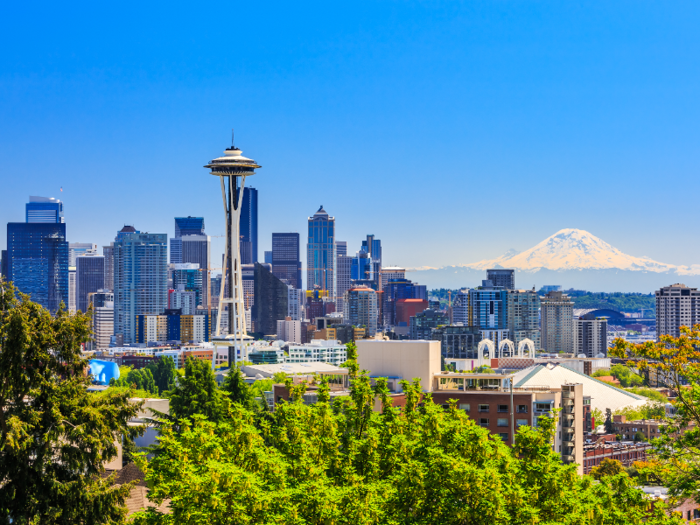
Washington's average weekly wage of $1,153 in November 2018 was the second-highest among the states and DC, and its Q2 2018 GDP per capita of $75,483 was sixth-highest.
4. Colorado

Colorado's Q2 2018 GDP growth rate of 4.9% was tied for fifth-highest among the states and DC, and its non-farm payroll job growth rate of 2.6% between November 2017 and November 2018 was the eighth-highest.
3. Texas
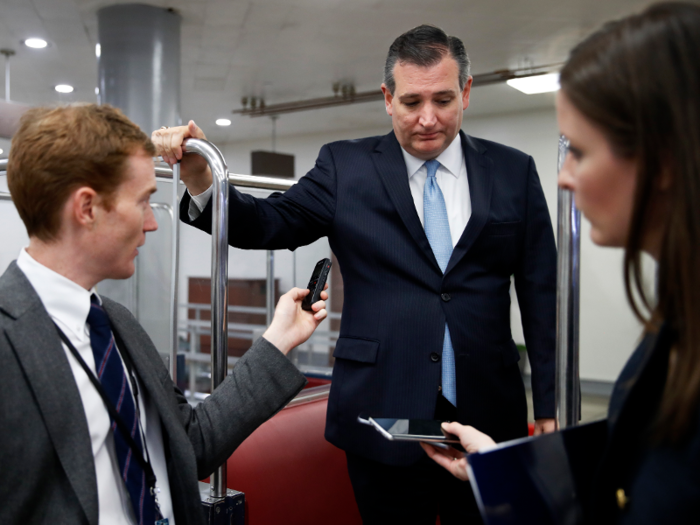
Texas' non-farm payroll job growth rate of 3.0% between November 2017 and November 2018 was the fourth-highest among the states and DC, and its Q2 2018 GDP growth rate of 6.0% was the highest.
2. Wyoming

Wyoming's average weekly wage growth rate of 11.8% between November 2017 and November 2018 was the highest among the states and DC, and its non-farm payroll job growth rate of 3.2% over that year was the third-highest.
1. District of Columbia
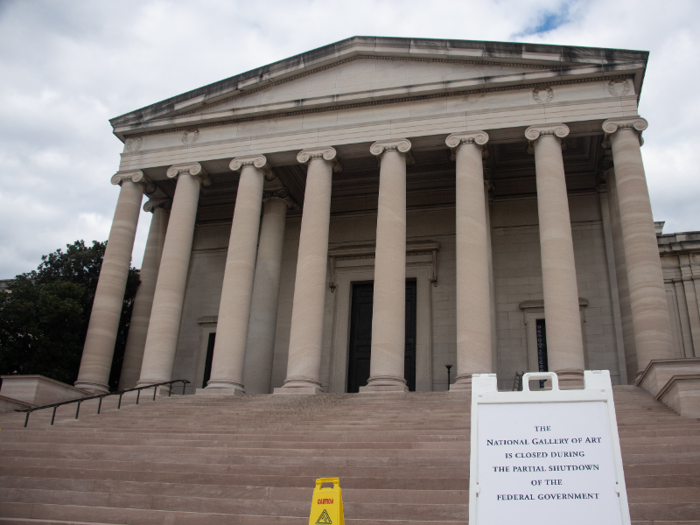
Washington, DC once again comes in first place in our ranking. The capital's Q2 2018 GDP per capita of $202,726 and November 2018 average weekly wage of $1,532 were both by far the highest in the country.
Popular Right Now
Popular Keywords
Advertisement