The 20 cities in the South that Americans are escaping in droves
20. Laredo, Texas, had a net population loss from migration of 7,690 between 2010 and 2018 — 3.1% of the metro's 2010 population of 250,304.

19. Anniston-Oxford-Jacksonville, Alabama, had a net population loss from migration of 3,673 between 2010 and 2018 — 3.1% of the metro's 2010 population of 118,572.

18. Macon-Bibb County, Georgia, had a net population loss from migration of 7,291 between 2010 and 2018 — 3.1% of the metro's 2010 population of 232,293.

17. Fayetteville, North Carolina, had a net population loss from migration of 11,602 between 2010 and 2018 — 3.2% of the metro's 2010 population of 366,383.

16. Monroe, Louisiana, had a net population loss from migration of 5,596 between 2010 and 2018 — 3.2% of the metro's 2010 population of 176,441.

15. Montgomery, Alabama, had a net population loss from migration of 12,144 between 2010 and 2018 — 3.2% of the metro's 2010 population of 374,356.

14. Houma-Thibodaux, Louisiana, had a net population loss from migration of 7,035 between 2010 and 2018 — 3.4% of the metro's 2010 population of 208,178.

13. El Paso, Texas, had a net population loss from migration of 27,599 between 2010 and 2018 — 3.4% of the metro's 2010 population of 804,123.

12. New Bern, North Carolina, had a net population loss from migration of 4,922 between 2010 and 2018 — 3.9% of the metro's 2010 population of 126,802.

11. Shreveport-Bossier City, Louisiana, had a net population loss from migration of 17,484 between 2010 and 2018 — 4.0% of the metro's 2010 population of 439,811.

10. Sumter, South Carolina, had a net population loss from migration of 4,323 between 2010 and 2018 — 4.0% of the metro's 2010 population of 107,456.

9. Beckley, West Virginia, had a net population loss from migration of 5,363 between 2010 and 2018 — 4.3% of the metro's 2010 population of 124,898.

8. Jacksonville, North Carolina, had a net population loss from migration of 7,895 between 2010 and 2018 — 4.4% of the metro's 2010 population of 177,772.

7. Rocky Mount, North Carolina, had a net population loss from migration of 7,021 between 2010 and 2018 — 4.6% of the metro's 2010 population of 152,392.

6. Brownsville-Harlingen, Texas, had a net population loss from migration of 20,487 between 2010 and 2018 — 5.0% of the metro's 2010 population of 406,220.

5. Charleston, West Virginia, had a net population loss from migration of 12,194 between 2010 and 2018 — 5.4% of the metro's 2010 population of 227,078.

4. Albany, Georgia, had a net population loss from migration of 9,674 between 2010 and 2018 — 6.1% of the metro's 2010 population of 157,308.

3. Lawton, Oklahoma, had a net population loss from migration of 11,422 between 2010 and 2018 — 8.8% of the metro's 2010 population of 130,291.

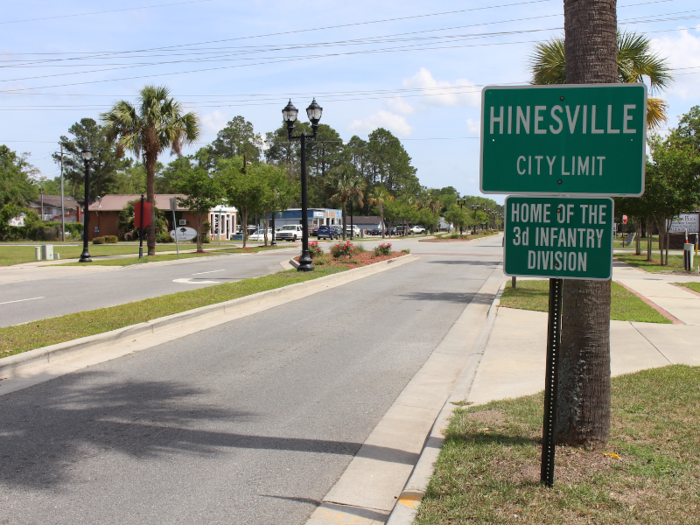
2. Hinesville, Georgia, had a net population loss from migration of 8,248 between 2010 and 2018 — 10.6% of the metro's 2010 population of 77,917.
1. Pine Bluff, Arkansas, had a net population loss from migration of 11,360 between 2010 and 2018 — 11.3% of the metro's 2010 population of 100,258.


Popular Right Now
Popular Keywords
Advertisement