The 20 cities in the Northeast that Americans are escaping in droves
20. Hartford-West Hartford-East Hartford, Connecticut, had a net population loss from migration of 18,697 between 2010 and 2018 — 1.5% of the metro's 2010 population of 1,212,381.

19. Altoona, Pennsylvania, had a net population loss from migration of 2,001 between 2010 and 2018 — 1.6% of the metro's 2010 population of 127,089.

18. Lewiston-Auburn, Maine, had a net population loss from migration of 1,753 between 2010 and 2018 — 1.6% of the metro's 2010 population of 107,702.

17. Kingston, New York, had a net population loss from migration of 3,069 between 2010 and 2018 — 1.7% of the metro's 2010 population of 182,493.

16. New Haven-Milford, Connecticut, had a net population loss from migration of 14,814 between 2010 and 2018 — 1.7% of the metro's 2010 population of 862,477.

15. Glens Falls, New York, had a net population loss from migration of 2,405 between 2010 and 2018 — 1.9% of the metro's 2010 population of 128,923.

14. Williamsport, Pennsylvania, had a net population loss from migration of 2,245 between 2010 and 2018 — 1.9% of the metro's 2010 population of 116,111.

13. Rochester, New York, had a net population loss from migration of 23,528 between 2010 and 2018 — 2.2% of the metro's 2010 population of 1,079,671.

12. New York-Newark-Jersey City, New York-New Jersey, had a net population loss from migration of 448,336 between 2010 and 2018 — 2.3% of the metro's 2010 population of 19,567,410.

11. Trenton, New Jersey, had a net population loss from migration of 8,539 between 2010 and 2018 — 2.3% of the metro's 2010 population of 366,513.

10. Utica-Rome, New York, had a net population loss from migration of 8,098 between 2010 and 2018 — 2.7% of the metro's 2010 population of 299,397.

9. Syracuse, New York, had a net population loss from migration of 23,156 between 2010 and 2018 — 3.5% of the metro's 2010 population of 662,577.

8. Norwich-New London, Connecticut, had a net population loss from migration of 9,732 between 2010 and 2018 — 3.6% of the metro's 2010 population of 274,055.

7. Erie, Pennsylvania, had a net population loss from migration of 11,067 between 2010 and 2018 — 3.9% of the metro's 2010 population of 280,566.

6. Binghamton, New York, had a net population loss from migration of 11,484 between 2010 and 2018 — 4.6% of the metro's 2010 population of 251,725.

5. Atlantic City-Hammonton, New Jersey, had a net population loss from migration of 12,869 between 2010 and 2018 — 4.7% of the metro's 2010 population of 274,549.

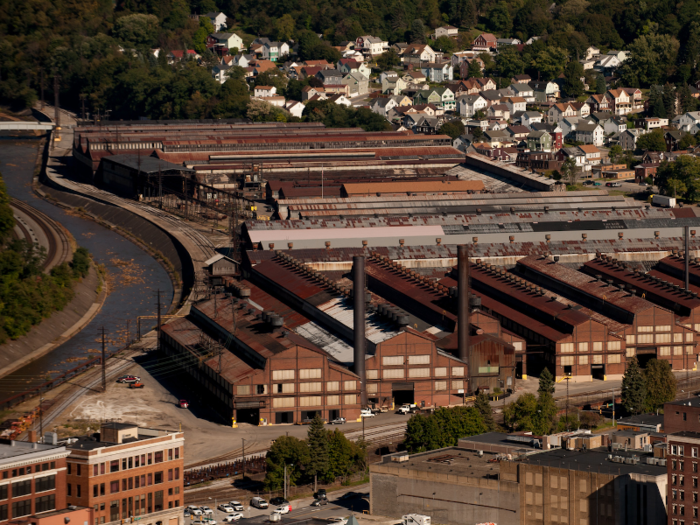
4. Johnstown, Pennsylvania, had a net population loss from migration of 7,980 between 2010 and 2018 — 5.6% of the metro's 2010 population of 143,679.
3. Elmira, New York, had a net population loss from migration of 4,950 between 2010 and 2018 — 5.6% of the metro's 2010 population of 88,830.

2. Vineland-Bridgeton, New Jersey, had a net population loss from migration of 10,118 between 2010 and 2018 — 6.4% of the metro's 2010 population of 156,898.

1. Watertown-Fort Drum, New York, had a net population loss from migration of 14,329 between 2010 and 2018 — 12.3% of the metro's 2010 population of 116,229.

Popular Right Now
Advertisement