The 20 cities in the Midwest that Americans are escaping in droves
20. Muncie, Indiana, had a net population loss from migration of 2,889 between 2010 and 2018 — 2.5% of the metro's 2010 population of 117,671.

19. Springfield, Illinois, had a net population loss from migration of 5,327 between 2010 and 2018 — 2.5% of the metro's 2010 population of 210,170.

18. Bay City, Michigan, had a net population loss from migration of 2,745 between 2010 and 2018 — 2.5% of the metro's 2010 population of 107,771.

17. Topeka, Kansas, had a net population loss from migration of 5,964 between 2010 and 2018 — 2.6% of the metro's 2010 population of 233,870.

16. Manhattan, Kansas, had a net population loss from migration of 2,405 between 2010 and 2018 — 2.6% of the metro's 2010 population of 92,719.

15. Mansfield, Ohio, had a net population loss from migration of 3,332 between 2010 and 2018 — 2.7% of the metro's 2010 population of 124,475.

14. Youngstown-Warren-Boardman, Ohio-Pennsylvania, had a net population loss from migration of 15,617 between 2010 and 2018 — 2.8% of the metro's 2010 population of 565,773.

13. Bloomington, Illinois, had a net population loss from migration of 5,169 between 2010 and 2018 — 2.8% of the metro's 2010 population of 186,133.

12. Carbondale-Marion, Illinois, had a net population loss from migration of 4,116 between 2010 and 2018 — 3.3% of the metro's 2010 population of 126,575.

11. Toledo, Ohio, had a net population loss from migration of 20,390 between 2010 and 2018 — 3.3% of the metro's 2010 population of 610,001.

10. Chicago-Naperville-Elgin, Illinois-Indiana-Wisconsin, had a net population loss from migration of 365,909 between 2010 and 2018 — 3.9% of the metro's 2010 population of 9,461,105.

9. Sioux City, Iowa, had a net population loss from migration of 6,978 between 2010 and 2018 — 4.1% of the metro's 2010 population of 168,563.

8. Kankakee, Illinois, had a net population loss from migration of 5,386 between 2010 and 2018 — 4.7% of the metro's 2010 population of 113,449.

7. Lima, Ohio, had a net population loss from migration of 5,125 between 2010 and 2018 — 4.8% of the metro's 2010 population of 106,331.

6. Peoria, Illinois, had a net population loss from migration of 18,737 between 2010 and 2018 — 4.9% of the metro's 2010 population of 379,186.

5. Saginaw, Michigan, had a net population loss from migration of 10,863 between 2010 and 2018 — 5.4% of the metro's 2010 population of 200,169.

4. Flint, Michigan, had a net population loss from migration of 23,255 between 2010 and 2018 — 5.5% of the metro's 2010 population of 425,790.

3. Rockford, Illinois, had a net population loss from migration of 20,375 between 2010 and 2018 — 5.8% of the metro's 2010 population of 349,431.

2. Decatur, Illinois, had a net population loss from migration of 7,220 between 2010 and 2018 — 6.5% of the metro's 2010 population of 110,768.

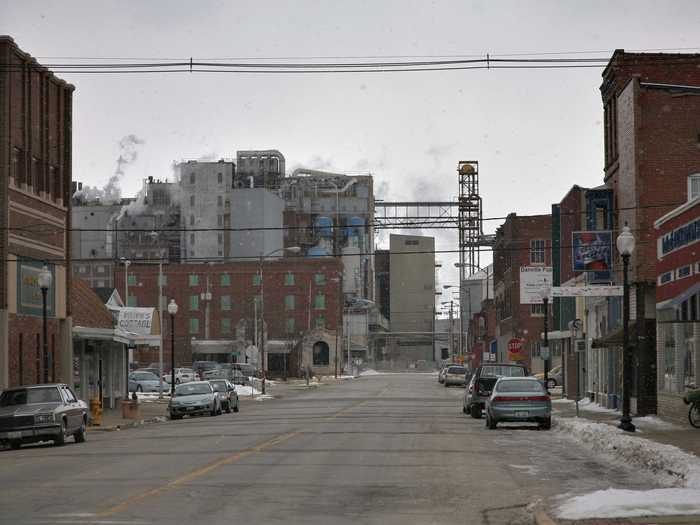
1. Danville, Illinois, had a net population loss from migration of 5,455 between 2010 and 2018 — 6.7% of the metro's 2010 population of 81,625.

Popular Right Now
Popular Keywords
Advertisement