The 15 Florida cities everyone in the country is moving to
15. Ocala had net migration of 39,511 between 2010 and 2018 — 11.9% of the metro's 2010 population of 331,298.

14. Palm Bay-Melbourne-Titusville had net migration of 66,747 between 2010 and 2018 — 12.3% of the metro's 2010 population of 543,376.

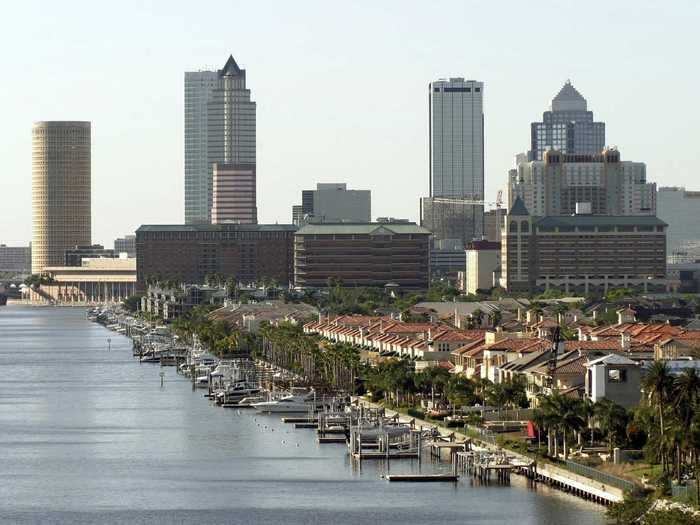
13. Tampa-St. Petersburg-Clearwater had net migration of 344,163 between 2010 and 2018 — 12.4% of the metro's 2010 population of 2,783,243.
12. Homosassa Springs had net migration of 18,293 between 2010 and 2018 — 13.0% of the metro's 2010 population of 141,236.

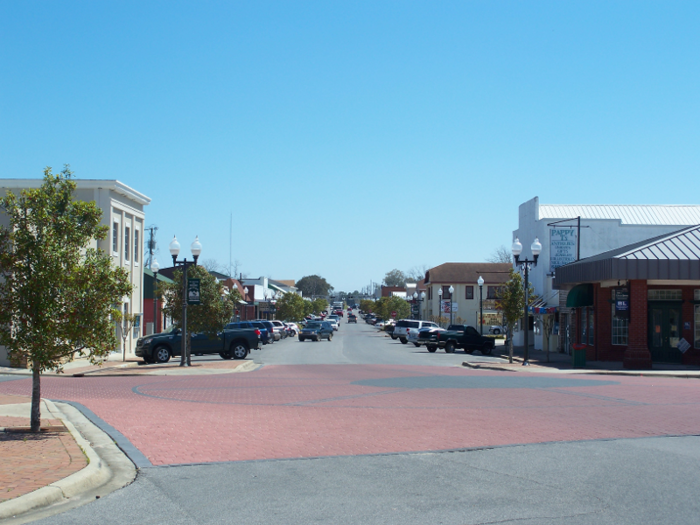
11. Crestview-Fort Walton Beach-Destin had net migration of 32,718 between 2010 and 2018 — 13.9% of the metro's 2010 population of 235,865.
10. Deltona-Daytona Beach-Ormund Beach had net migration of 87,461 between 2010 and 2018 — 14.8% of the metro's 2010 population of 590,289.

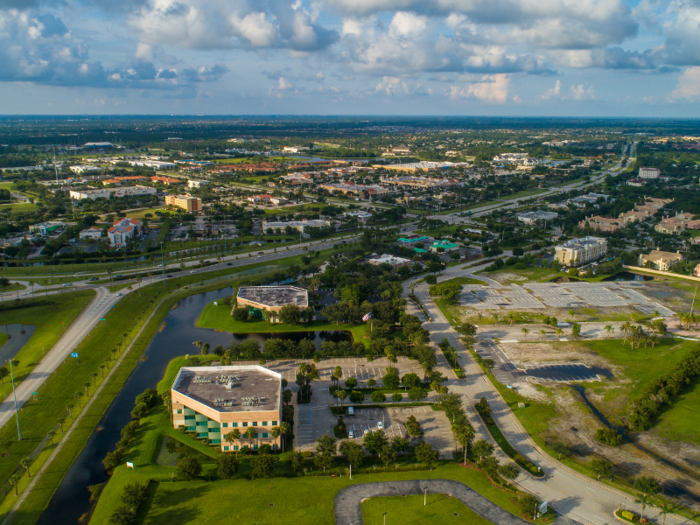
9. Port St. Lucie had net migration of 62,896 between 2010 and 2018 — 14.8% of the metro's 2010 population of 424,107.
8. Lakeland-Winter Haven had net migration of 96,548 between 2010 and 2018 — 16.0% of the metro's 2010 population of 602,095.

7. Orlando-Kissimmee-Sanford had net migration of 344,022 between 2010 and 2018 — 16.1% of the metro's 2010 population of 2,134,411.

6. Naples-Immokalee-Marco Island had net migration of 56,188 between 2010 and 2018 — 17.5% of the metro's 2010 population of 321,520.

5. Sebastian-Vero Beach had net migration of 24,647 between 2010 and 2018 — 17.9% of the metro's 2010 population of 138,028.

4. North Port-Sarasota-Bradenton had net migration of 140,889 between 2010 and 2018 — 20.1% of the metro's 2010 population of 702,281.

3. Cape Coral-Fort Myers had net migration of 135,696 between 2010 and 2018 — 21.9% of the metro's 2010 population of 618,754.

2. Punta Gorda had net migration of 36,551 between 2010 and 2018 — 22.8% of the metro's 2010 population of 159,978.

1. The Villages had net migration of 43,639 between 2010 and 2018 — 46.7% of the metro's 2010 population of 93,420.


Popular Right Now
Popular Keywords
Advertisement