Rhode Island has the United States' worst roads - here's how other states rank
12. Connecticut

11. Wisconsin
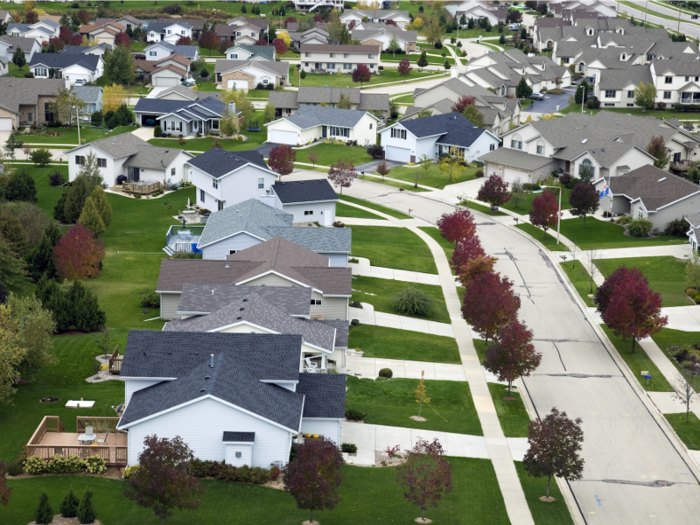
- % of roads in poor condition: 29
- Cost per motorist: $736
- % of bridges that are structurally deficient: 6
- % of spending on road repairs: 39
10. New Mexico
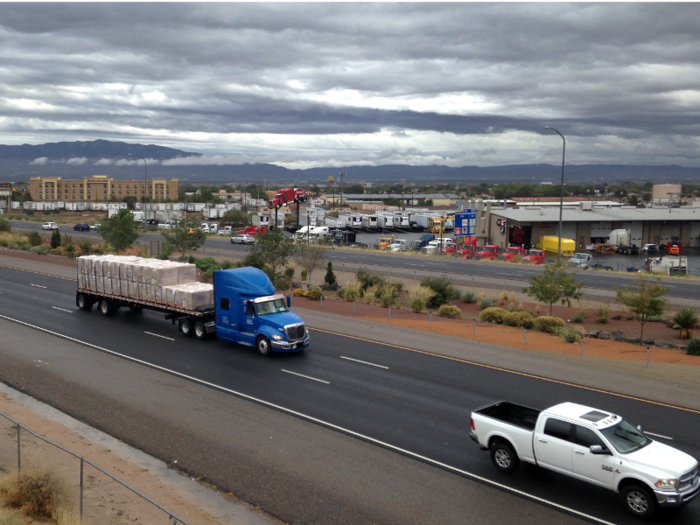
- % of roads in poor condition: 31
- Cost per motorist: $768
- % of bridges that are structurally deficient: 6
- % of spending on road repairs:39
9. Louisiana
- % of roads in poor condition: 25
- Cost per motorist: $624
- % of bridges that are structurally deficient: 14
- % of spending on road repairs: 22
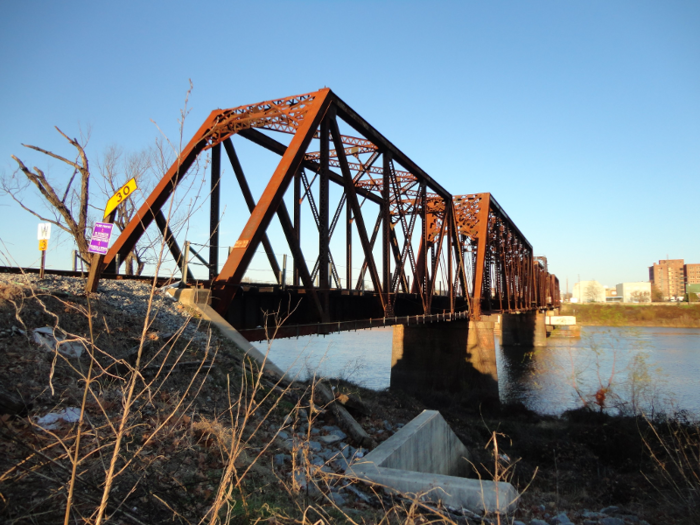
8. Missouri
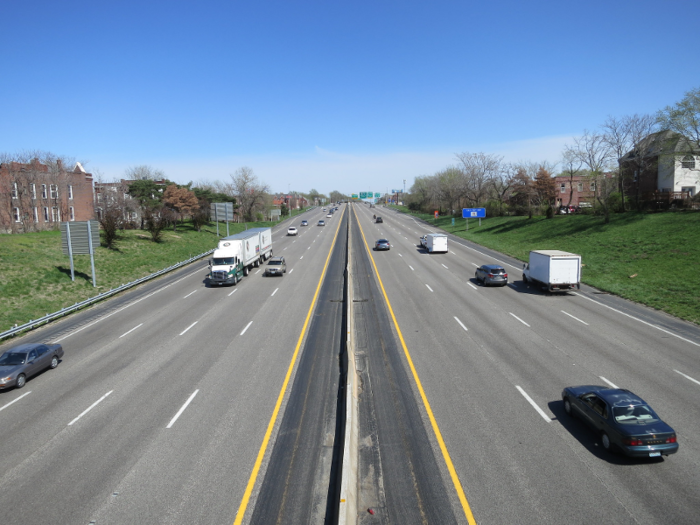
- % of roads in poor condition: 23
- Cost per motorist: $699
- % of bridges that are structurally deficient: 12
- % of spending on road repairs: 20
7. California

- % of roads in poor condition: 45
- Cost per motorist: $862
- % of bridges that are structurally deficient: 6
- % of spending on road repairs: 35
6. New Jersey
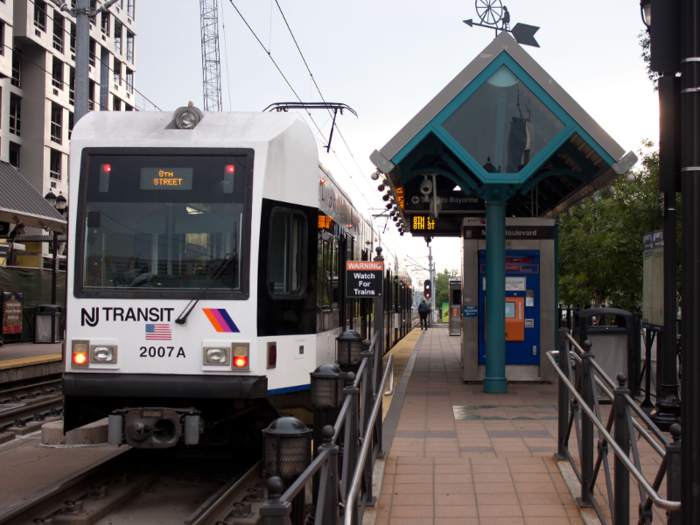
- % of roads in poor condition: 34
- Cost per motorist: $703
- % of bridges that are structurally deficient: 8
- % of spending on road repairs: 57
5. Pennsylvania
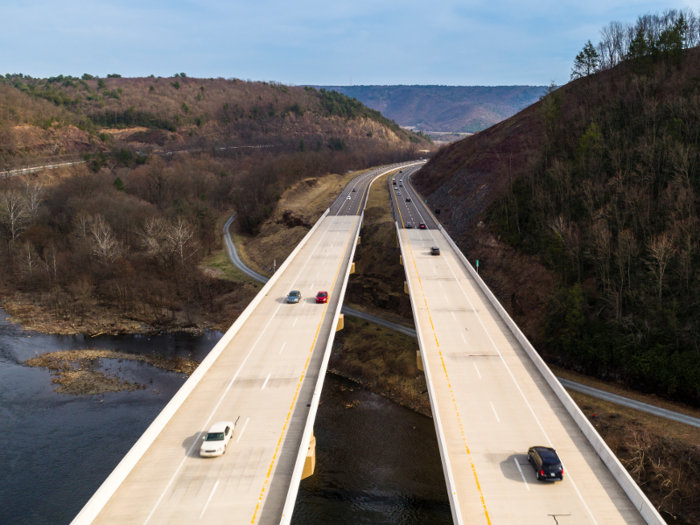
- % of roads in poor condition: 30
- Cost per motorist: $610
- % of bridges that are structurally deficient: 18
- % of spending on road repairs: 22
4. Mississippi
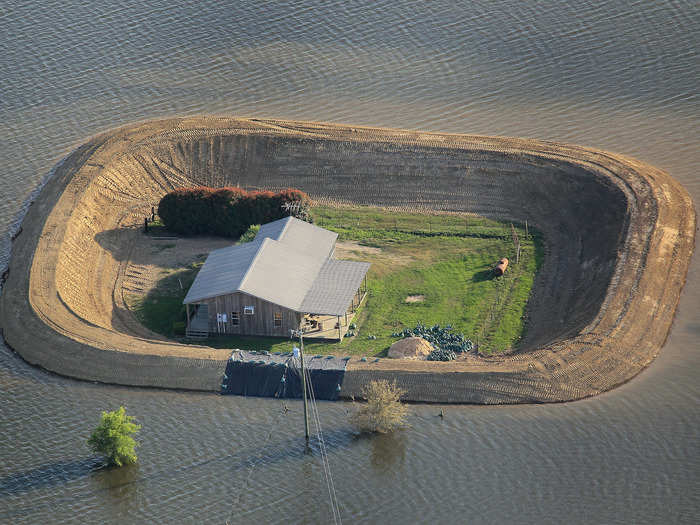
- % of roads in poor condition: 30
- Cost per motorist: $820
- % of bridges that are structurally deficient: 11
- % of spending on road repairs: 4
3. West Virginia
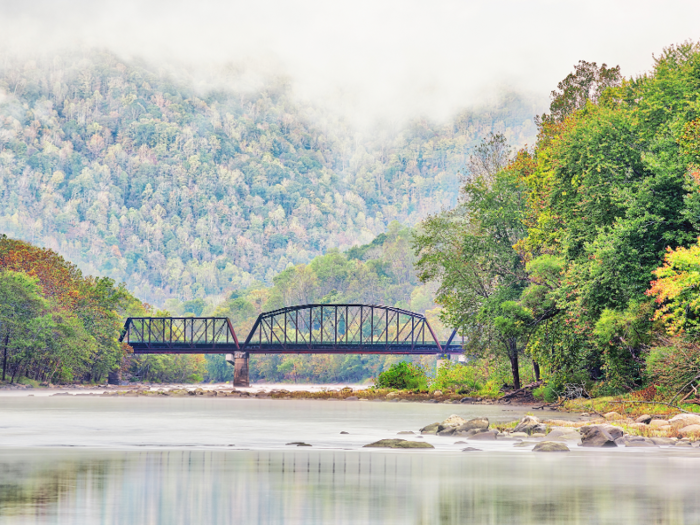
- % of roads in poor condition: 31
- Cost per motorist: 723
- % of bridges that are structurally deficient: 18
- % of spending on road repairs: 19
2. Oklahoma
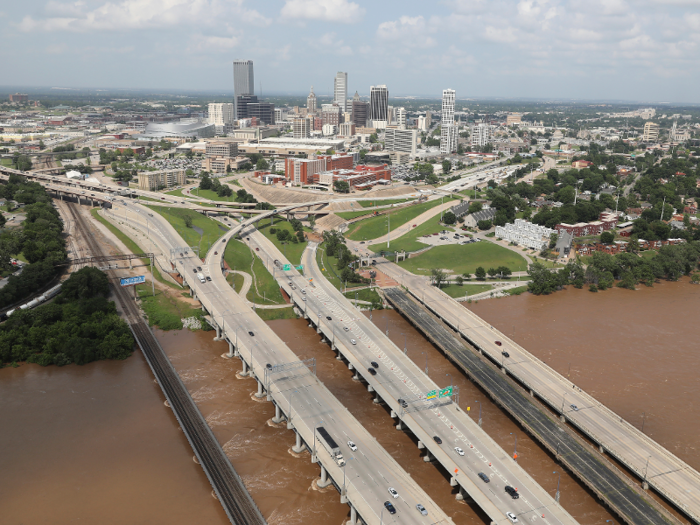
- % of roads in poor condition: 33
- Cost per motorist: $900
- % of bridges that are structurally deficient: 14
- % of spending on road repairs: 27
1. Rhode Island

- % of roads in poor condition: 53
- Cost per motorist: $823
- % of bridges that are structurally deficient: 23
- % of spending on road repairs: 2
Popular Right Now
Advertisement