- Home
- slideshows
- miscellaneous
- Here's what the average person spends on their commute annually in every state
Here's what the average person spends on their commute annually in every state
West Virginia: $2,003.81

Mississippi: $2,141.44
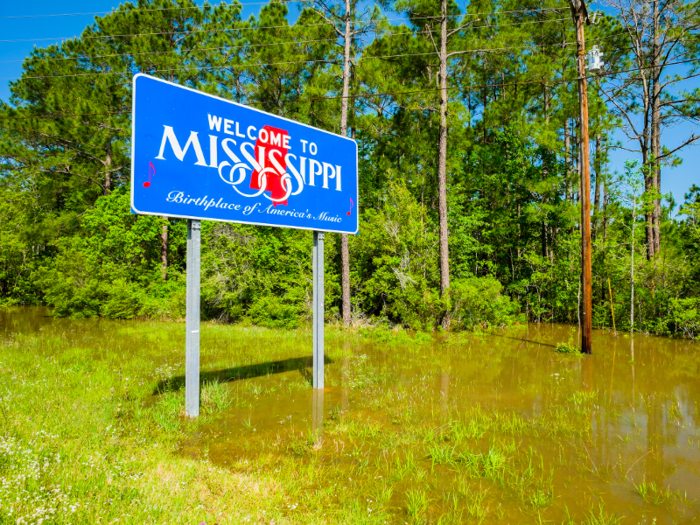
In Mississippi, transportation spending totaled over $2,100 annually. The state's 1,214,929 people spent an average of 24.9 each day commuting to work.
Drove alone: 85.5%
Carpooled: 9.1%
Public transportation (excluding taxicab): 0.3%
Walked: 1.4%
Other means: 1.5%
Worked from home: 2.3%
Alabama: $2,178.20
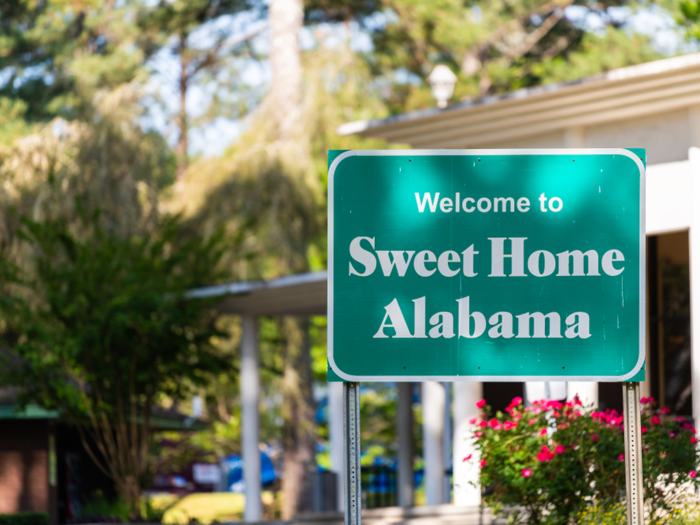
Alabama's transportation spending totaled over $2,175 per year. The state's 2,041,619 workers experienced travel times of 24.6 minutes per day.
Drove alone: 85.7%
Carpooled: 8.5%
Public transportation (excluding taxicab): 0.4%
Walked: 1.2%
Other means: 1%
Worked from home: 3.4%
Kentucky: $2,200.03

Transportation spending in Kentucky totaled just over $2,200 annually. The state's mean commute time totaled 23.3 minutes each day. Kentucky had 1,948,608 workers when the survey was completed.
Drove alone: 82%
Carpooled: 9.4%
Public transportation (excluding taxicab): 1.1%
Walked: 2.1%
Other means: 1.5%
Worked from home: 3.9%
Tennessee: $2,222.31
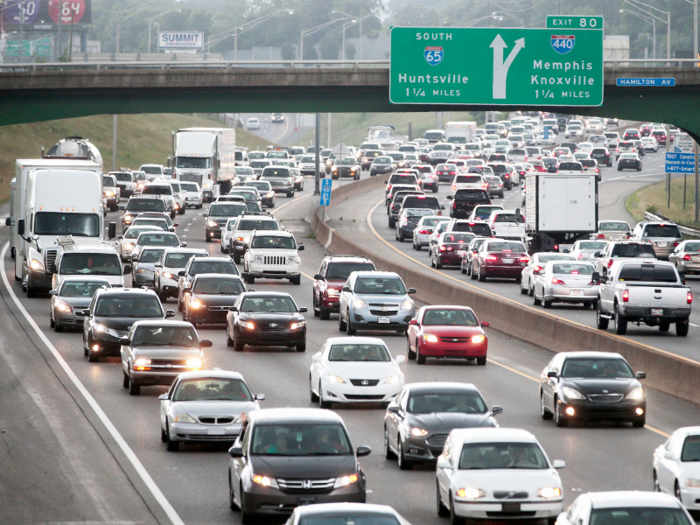
Transportation spending in Tennessee totaled over $2,200 per year. Tennessee's working individuals experienced average commute times of 25.1 minutes. The state's workforce included 3,079,158 people.
Drove alone: 83.2%
Carpooled: 8.8%
Public transportation (excluding taxicab): 0.6%
Walked: 1.3%
Other means: 1.2%
Worked from home: 4.9%
North Carolina: $2,243.04
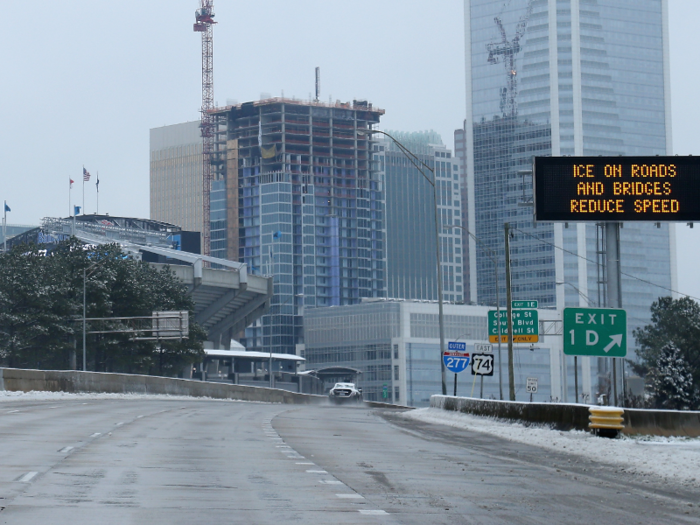
Transportation spending totaled over $2,200 annually in North Carolina. Workers also spent an average of 24.9 minutes commuting, a slightly higher amount than its southern neighbor's. Its workforce was nearly double that of South Carolina's with a total of 4,780,350 people.
Drove alone: 81.1%
Carpooled: 8.9%
Public transportation (excluding taxicab): 1%
Walked: 1.7%
Other means: 1.3%
Worked from home: 6.1%
Florida: $2,269.36
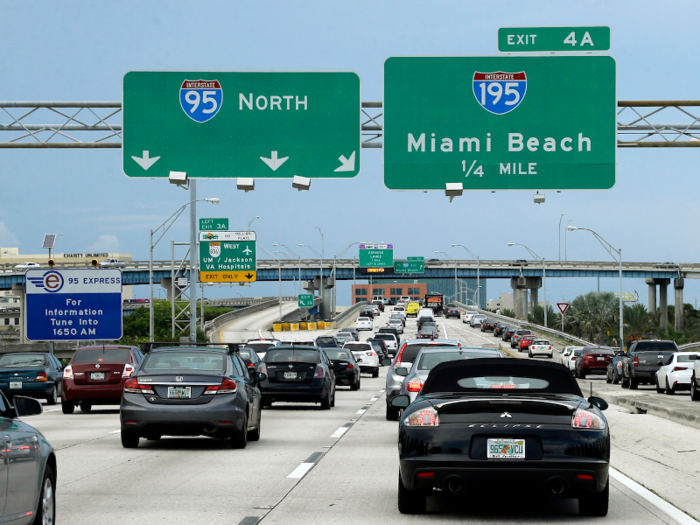
In Florida, transportation spending totaled over $2,200 annually. The Sunshine State's 9,355,081 people experienced average commute times of 27.8 minutes.
Drove alone: 79.4%
Carpooled: 9.1%
Public transportation (excluding taxicab): 1.7%
Walked: 1.4%
Other means: 2.3%
Worked from home: 6.1%
Arkansas: $2,327.42
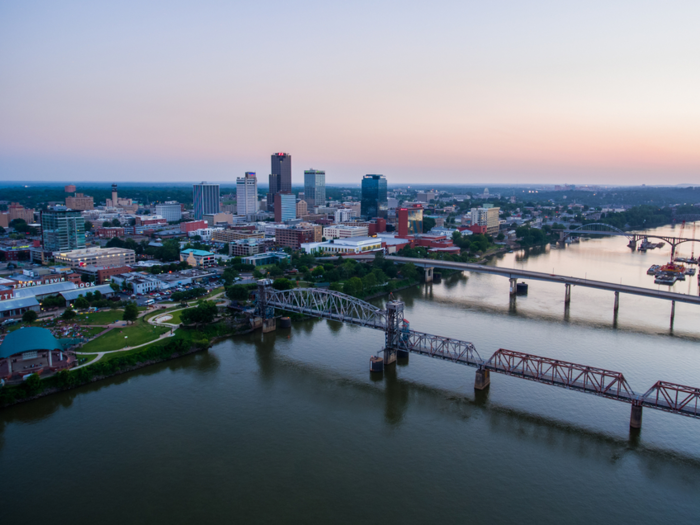
Transportation spending in Arkansas totaled over $2,300 annually. The state's 281,666 commuters experienced averages of 21.6 minutes.
Drove alone: 83.3%
Carpooled: 9.9%
Public transportation (excluding taxicab): 0.3%
Walked: 1.8%
Other means: 1%
Worked from home: 3.7%
Nevada: $2,390.62

Transportation spending in Nevada totaled close to $2,400 annually. Nevada's 1,402,611 workers experienced an average commute time of 24.2 minutes.
Drove alone: 78.5%
Carpooled: 9.8%
Public transportation (excluding taxicab): 3.1%
Walked: 1.9%
Other means: 2.4%
Worked from home: 4.3%
Louisiana: $2,395.07
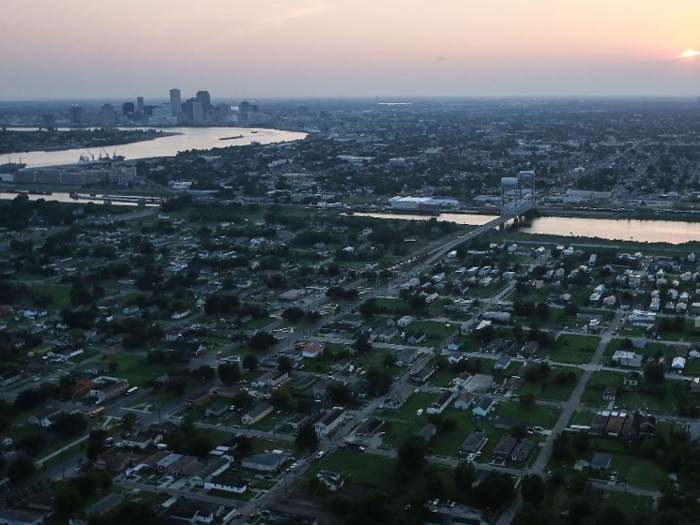
Like Nevada, Louisiana's annual transportation spending totaled close to $2,400. The state's 2,003,496 working individuals spent 25.3 minutes on average commuting daily.
Drove alone: 82.7%
Carpooled: 9.2%
Public transportation (excluding taxicab): 1.1%
Walked: 1.7%
Other means: 2%
Worked from home: 3.3%
South Carolina: $2,400.16
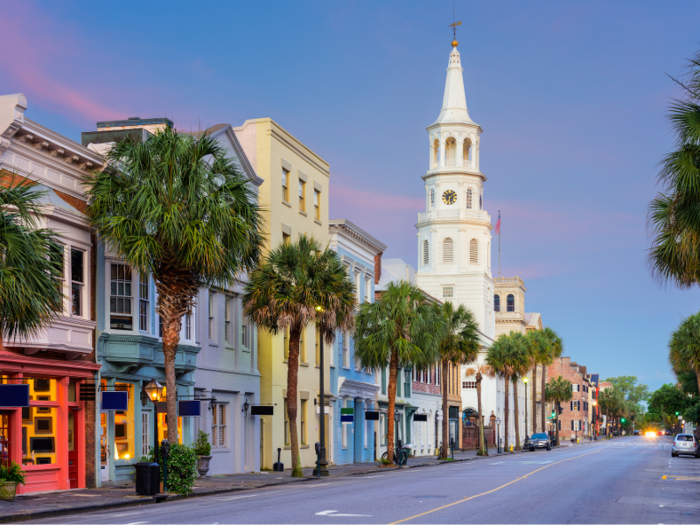
South Carolina's annual transportation spending totaled just over $2,400. The average time spent commuting totaled 24.6, and the state's workforce included 2,259,936 people.
Drove alone: 81.8%
Carpooled: 9.5%
Public transportation (excluding taxicab): 0.5%
Walked: 2.1%
Other means: 1.4%
Worked from home: 4.7%
Georgia: $2,403.55
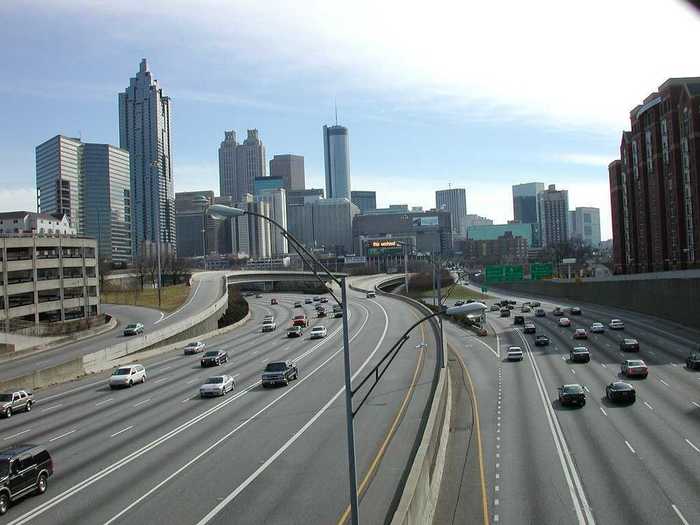
Georgia's transportation spending totaled over $2,400 annually. The state's 4,782,581 workers had average travel times of 28.8 minutes.
Drove alone: 78.7%
Carpooled: 9.9%
Public transportation (excluding taxicab): 2.1%
Walked: 1.6%
Other means: 1.9%
Worked from home: 5.8%
Rhode Island: $2,444.68
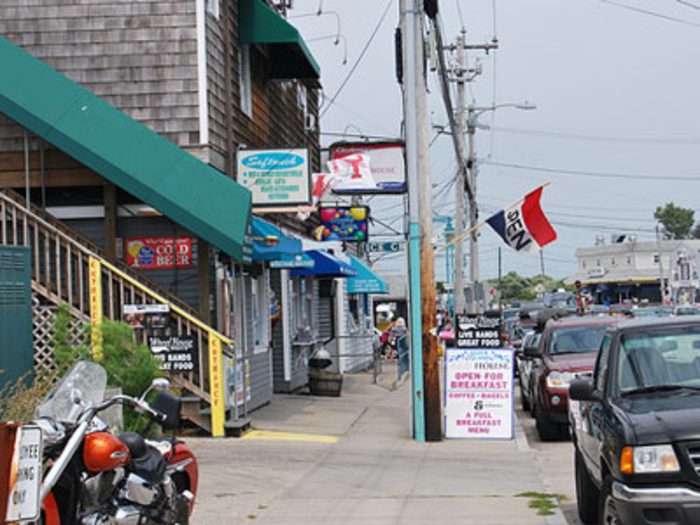
Transportation spending in Rhode Island totaled over $2,440 annually. The state's workforce of 522,214 spent an average of 25.1 minutes commuting to work.
Drove alone: 79.40%
Carpooled: 9.40%
Public transportation (excluding taxicab): 2.20%
Walked: 3.60%
Other means: 0.90%
Worked from home: 4.50%
Delaware: $2,517.60
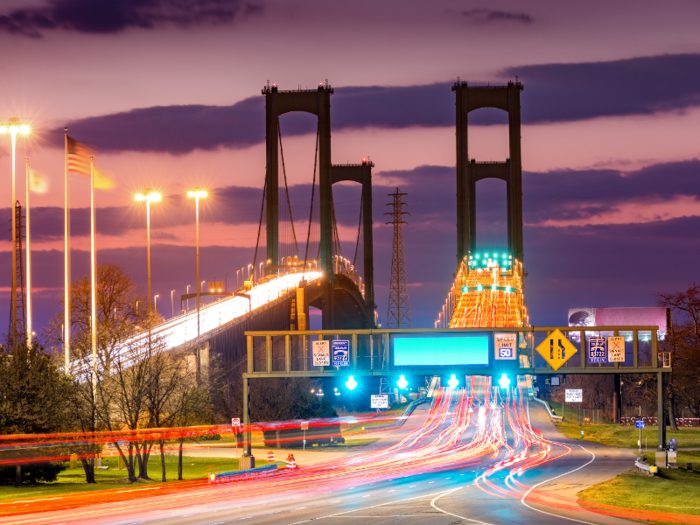
Transportation spending in Delaware totaled over $2,500 annually. Delaware's 430,780 workers experience mean travel times of 26.5 minutes.
Drove alone: 82%
Carpooled: 7.1%
Public transportation (excluding taxicab): 2.2%
Walked: 2.2%
Other means: 1.2%
Worked from home: 5.2%
Hawaii: $2,520.01
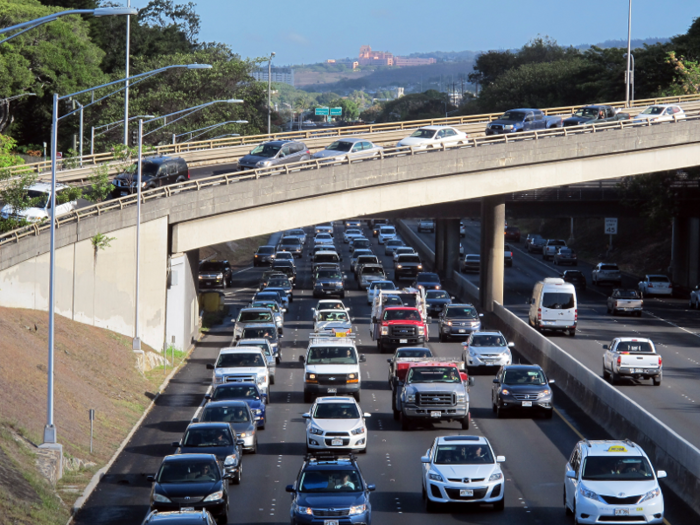
In Hawaii, transportation spending totaled over $2,500 per year. The state's 703,939 workers spent 27 minutes commuting on average.
Drove alone: 67.6%
Carpooled: 13.3%
Public transportation (excluding taxicab): 6.1%
Walked: 5.5%
Other means: 3.2%
Worked from home: 4.4%
Oklahoma: $2,523.62
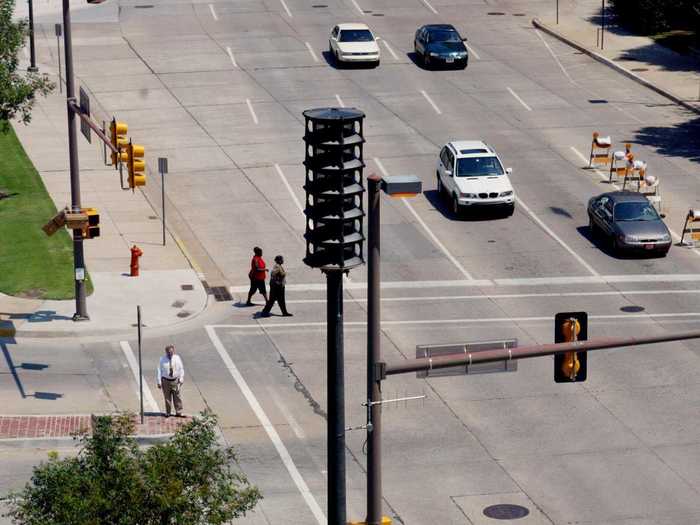
In Oklahoma, the annual transportation spending totaled over $2,500 annually per adult. The average commuting time was 21.9 minutes for the state's 1,744,677 workers.
Drove alone: 82.3%
Carpooled: 9.8%
Public transportation (excluding taxicab): 0.3%
Walked: 1.9%
Other means: 1.4%
Worked from home: 4.3%
Virginia: $2,599.62
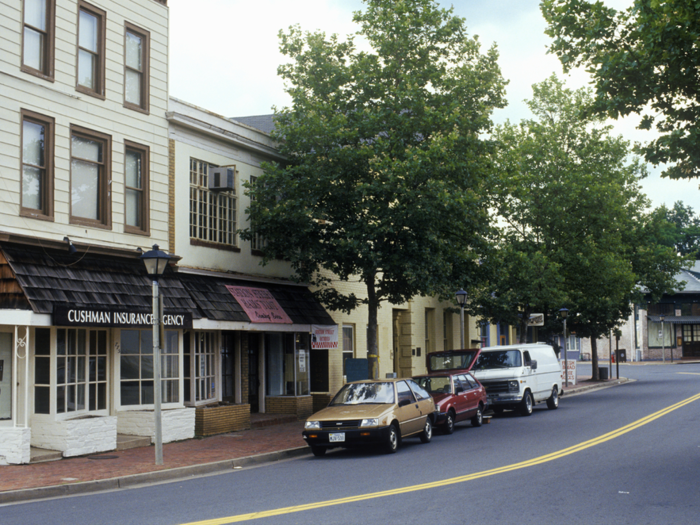
Transportation spending totaled close to $2,600 annually in Virginia. The state's 4,195,387 workers experienced average travel times of 28.6 minutes.
Drove alone: 77.4%
Carpooled: 8.7%
Public transportation (excluding taxicab): 4.2%
Walked: 2.6%
Other means: 1.8%
Worked from home: 5.4%
Kansas: $2,634.39
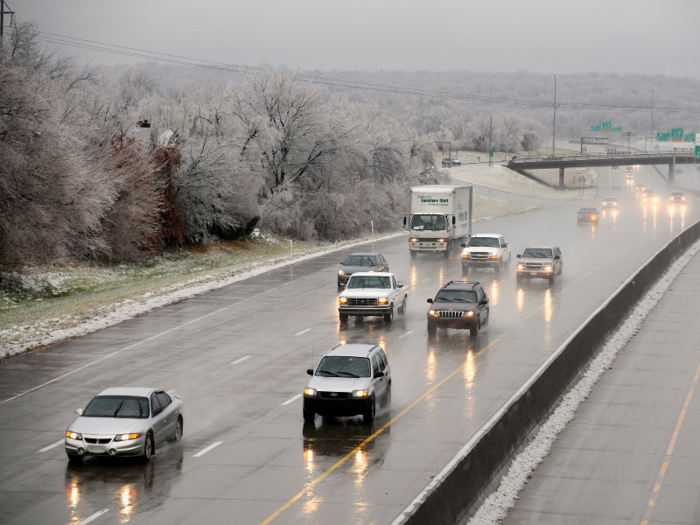
Transportation spending in Kansas totaled over $2,600 annually. The state's 1,431,057 workers had average commute times of 19.1 minutes.
Drove alone: 82.4%
Carpooled: 8.7%
Public transportation (excluding taxicab): 0.4%
Walked: 2.3%
Other means: 1.4%
Worked from home: 4.7%
Arizona: $2,764.98
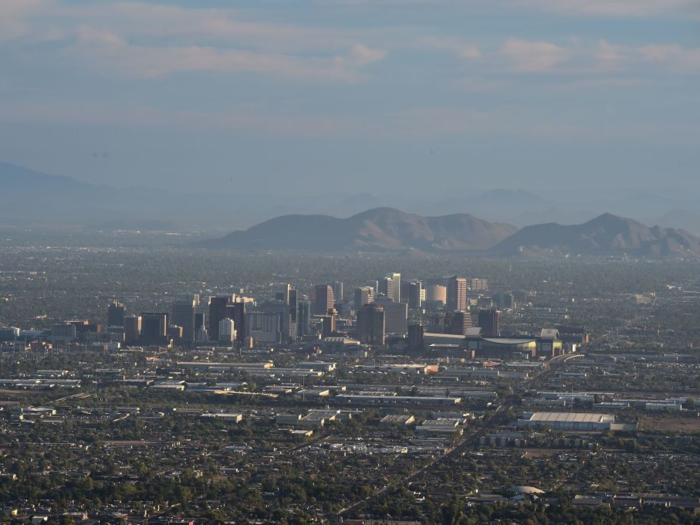
In Arizona, transportation spending totaled over $2,700 annually. Arizona workers — who totaled 3,086,150 in 2017 — experienced mean travel times of 25.6 for their daily commutes.
Drove alone: 76.5%
Carpooled: 11%
Public transportation (excluding taxicab): 1.8%
Walked: 2%
Other means: 2.4%
Worked from home: 6.3%
Oregon: $2,792.99
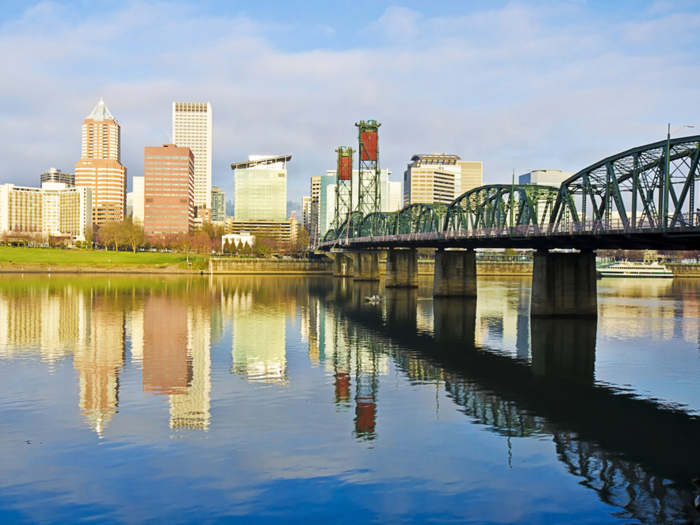
In Oregon, annual transportation spending totaled close to $2,800. Oregon's 1,953,055 workers also spent 24.3 minutes traveling during their daily commutes across the state.
Drove alone: 71.7%
Carpooled: 9.7%
Public transportation (excluding taxicab): 4.5%
Walked: 3.7%
Other means: 3.1%
Worked from home: 7.4%
Idaho: $2,838.36
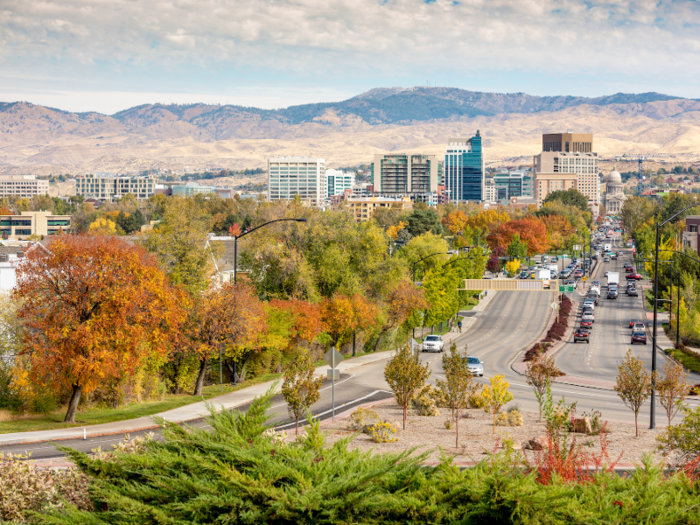
In Idaho, transportation spending totaled over $2,800 annually. Average commute times in Idaho totaled 21 minutes for the state's 773,999 workers.
Drove alone: 79.1%
Carpooled: 10.2%
Public transportation (excluding taxicab): 0.6%
Walked: 2.3%
Other means: 2.2%
Worked from home:5.7%
Maryland: $2,847.45
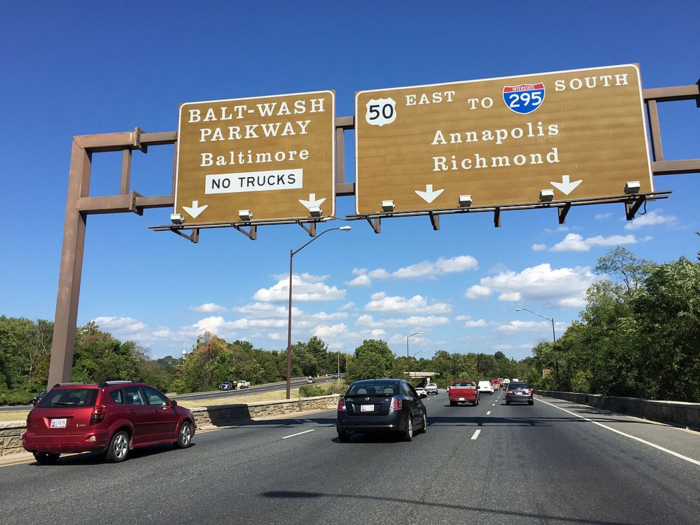
Maryland's transportation spending totaled over $2,800 annually. The average time of all commuters totaled 33.3 minutes.
Drove alone: 73.7%
Carpooled: 9.1%
Public transportation (excluding taxicab): 8.5%
Walked: 2.1%
Other means: 1.6%
Worked from home: 4.9%
Texas: $2,875.72
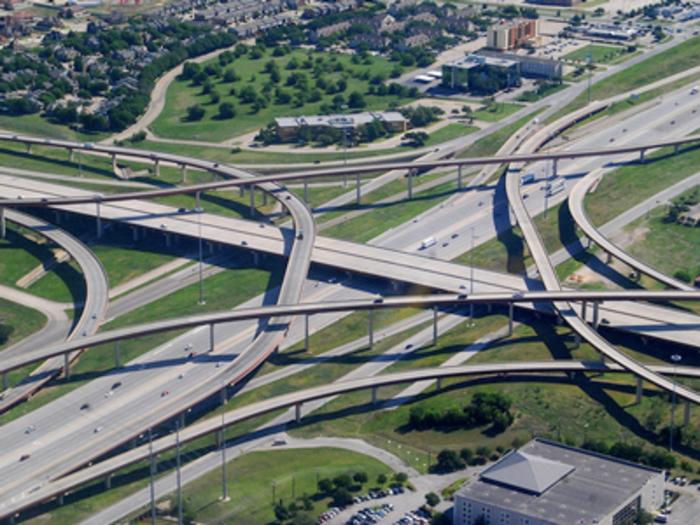
Texas' transportation spending totaled over $2,800 annually. In the Lone Star State, 13,051,002 workers spent 26.5 minutes on average commuting to their job.
Drove alone: 80.6%
Carpooled: 9.8%
Public transportation (excluding taxicab): 1.4%
Walked: 1.5%
Other means: 1.6%
Worked from home: 5.1%
Ohio: $2,925.79
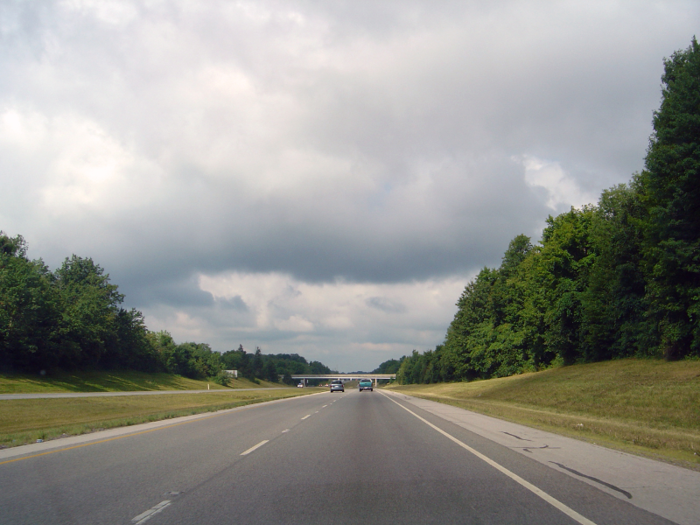
Transportation spending totaled over $2,900 annually in Ohio. The Midwestern state had 5,476,583 working individuals for this average; like Texas, the commute time averaged 23.6 minutes.
Drove alone: 83.3%
Carpooled: 7.7%
Public transportation (excluding taxicab): 1.5%
Walked: 2.1%
Other means: 1.2%
Worked from home: 4.2%
Utah: $2,931.13
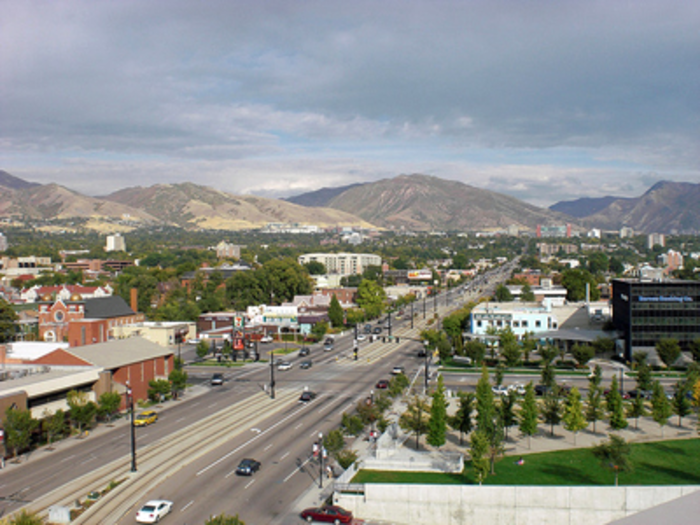
Utah's annual transportation spending totaled over $2,900. Utah's average commute time totaled 22 minutes; the state had 1,486,681 workers during the time of the survey.
Drove alone: 76.1%
Carpooled: 10.7%
Public transportation (excluding taxicab): 2.3%
Walked: 2.4%
Other means: 1.7%
Worked from home: 6.8%
New Mexico: $2,945.67
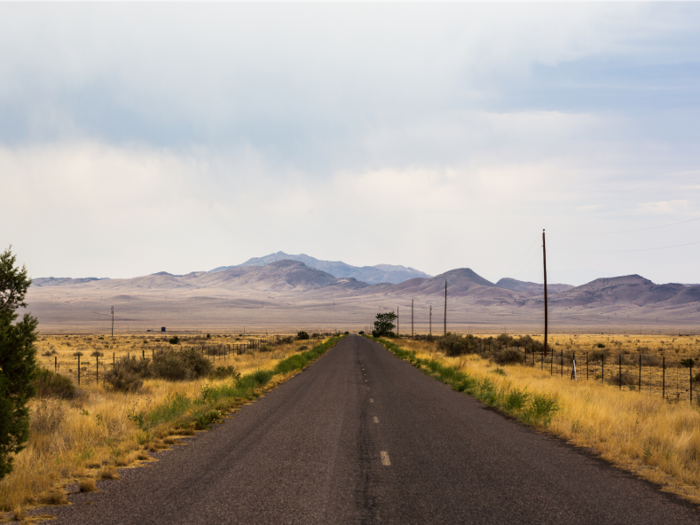
Transportation spending in New Mexico totaled almost $2,950 annually. New Mexico's 866,572 workers experienced average commute times of 22.3 minutes.
Drove alone: 79.4%
Carpooled: 10.6%
Public transportation (excluding taxicab): 1.1%
Walked: 2%
Other means: 1.8%
Worked from home: 5.1%
Indiana: $2,949.94
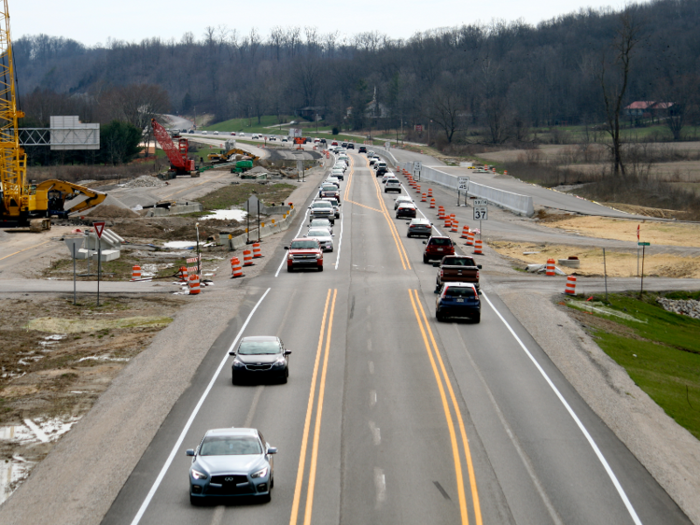
Like New Mexico, transportation spending in Indiana also totaled almost $2,950 annually. Indiana's 3,126,324 workers had a mean travel time of 23.6 minutes.
Drove alone: 82.4%
Carpooled: 8.7%
Public transportation (excluding taxicab): 0.9%
Walked: 2.1%
Other means: 1.5%
Worked from home: 4.3%
Pennsylvania: $3,029.01
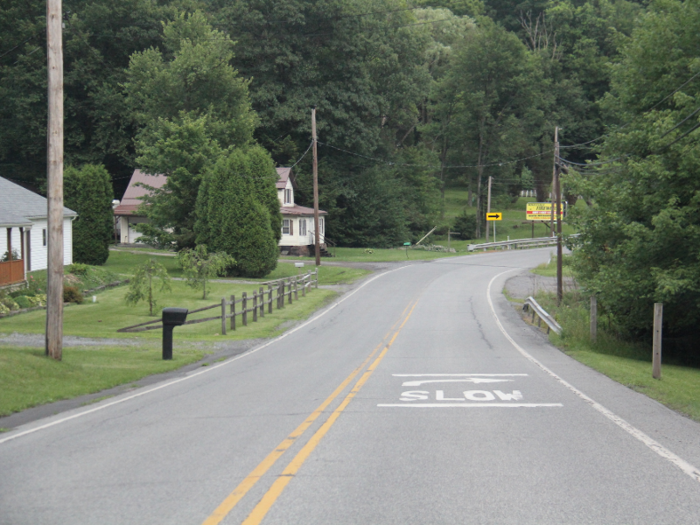
Transportation spending totaled just over $3,000 annually in Pennsylvania. The state's travel time averaged 27.1 minutes and its workforce numbered 6,056,160.
Drove alone: 76.2%
Carpooled: 8.5%
Public transportation (excluding taxicab): 5.3%
Walked: 3.5%
Other means: 1.5%
Worked from home: 5%
Illinois: $3,041.70
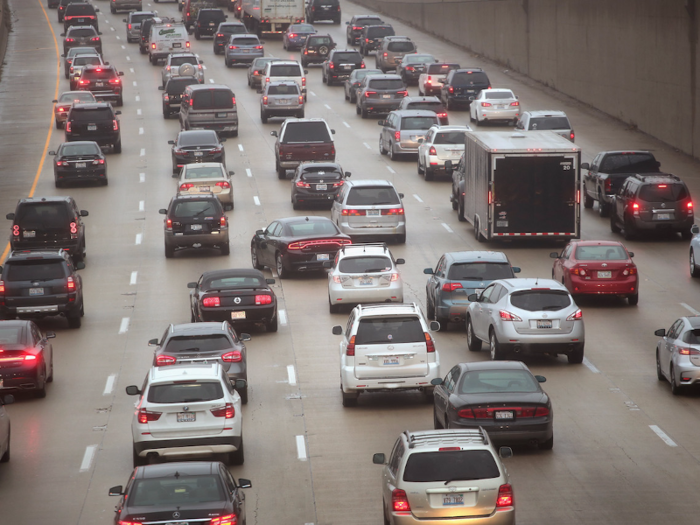
Transportation spending totaled over $3,000 annually in Illinois. The average commute time for Illinois' 6,129,046 workers totaled 29.1 minutes.
Drove alone: 73%
Carpooled: 7.8%
Public transportation (excluding taxicab): 9.6%
Walked: 2.9%
Other means: 1.8%
Worked from home: 4.9%
Missouri: $3,074.65
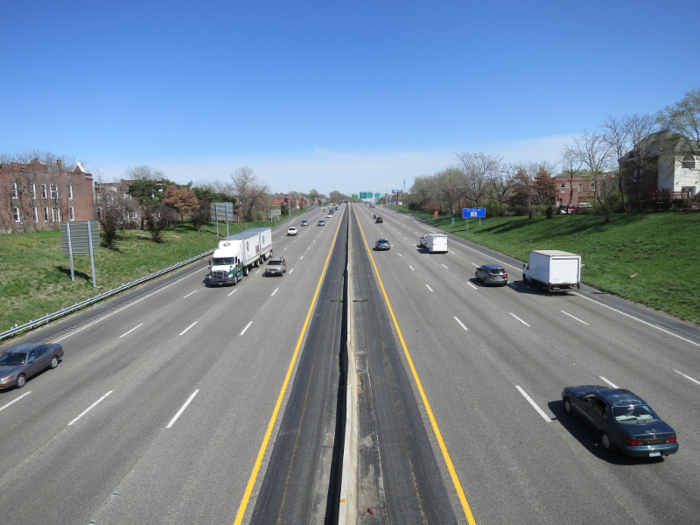
In Missouri, annual transportation spending totaled almost $3,100. Missouri's 2,881,692 workers, meanwhile, experienced average commute times of 23.7 minutes.
Drove alone: 82.2%
Carpooled: 8.4%
Public transportation (excluding taxicab): 1.3%
Walked: 1.9%
Other means: 1.1%
Worked from home: 5.1%
Alaska: $3,081.96
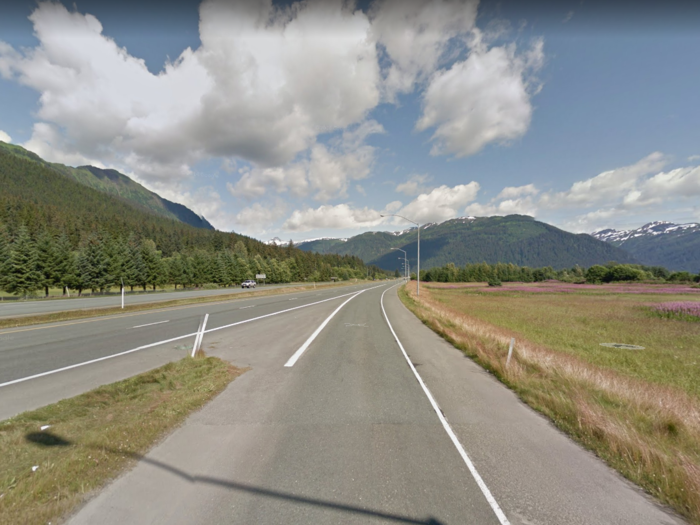
Alaska's transportation spending totaled almost $3,100 annually. Daily commutes in Alaska averaged 19.6 minutes. The state's workforce included 351,282 individuals.
Drove alone: 69.3%
Carpooled: 11.8%
Public transportation (excluding taxicab): 1.7%
Walked: 7.4%
Other means: 5.3%
Worked from home: 4.6%
Maine: $3,135.70
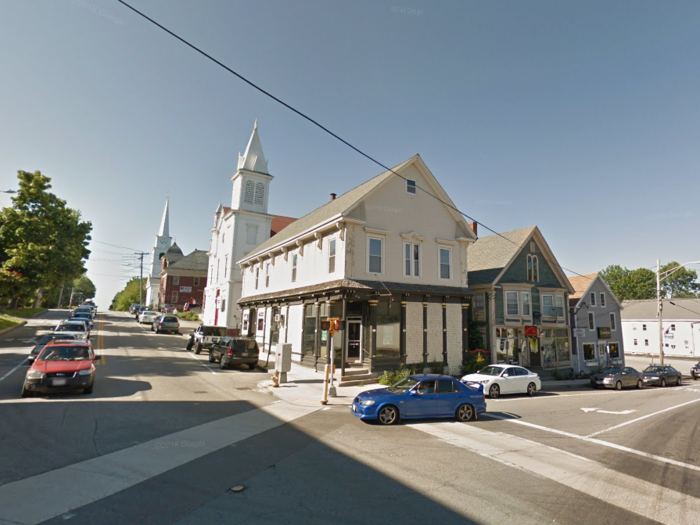
Maine's transportation spending totaled over $3,100 annually. The mean travel time to work in Maine was 24 minutes, and the state's workforce totaled 657,960 individuals.
Drove alone: 78.6%
Carpooled: 9.4%
Public transportation (excluding taxicab): 0.6%
Walked: 4.1%
Other means: 1.5%
Worked from home: 5.9%
District of Columbia: $3,143.98
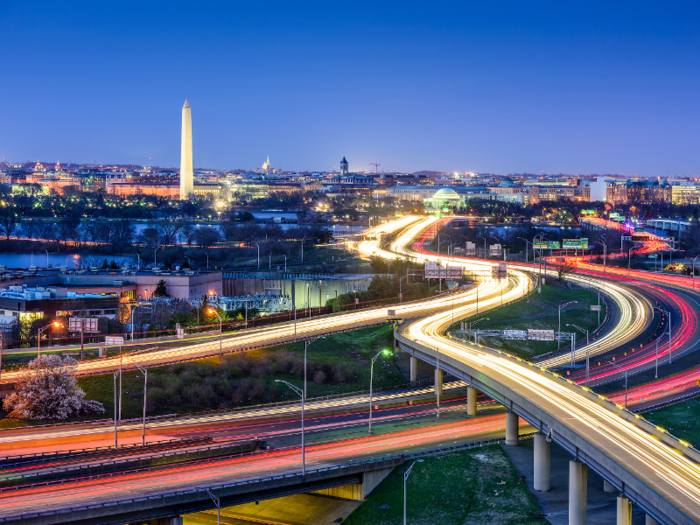
Transportation spending totaled over $3,100 annually in Washington, DC. The nation's capital has 375,380 workers — a total higher than Wyoming, Vermont, and Alaska. The city averaged 30.8 minutes for commuting time, along with having a significant percent use public transportation.
Drove alone: 34.4%
Carpooled: 5.2%
Public transportation (excluding taxicab): 32.7%
Walked: 12.7%
Other means: 7.7%
Worked from home: 7.4%
Wisconsin: $3,154.34

In Wisconsin, transportation spending totaled over $3,100 annually. Wisconsin's mean commute time was 22.2 minutes for 2,938,890 workers.
Drove alone: 81.1%
Carpooled: 7.6%
Public transportation (excluding taxicab): 1.8%
Walked: 3%
Other means: 1.6%
Worked from home: 4.9%
Colorado: $3,173.45

In Colorado, transportation spending totaled almost $3,175 annually. The state's 2,886,978 had average commute times of 25.9 minutes.
Drove alone: 74.9%
Carpooled: 8.6%
Public transportation (excluding taxicab): 3.2%
Walked: 2.7%
Other means: 2.2%
Worked from home: 8.5%
Washington: $3,175.70
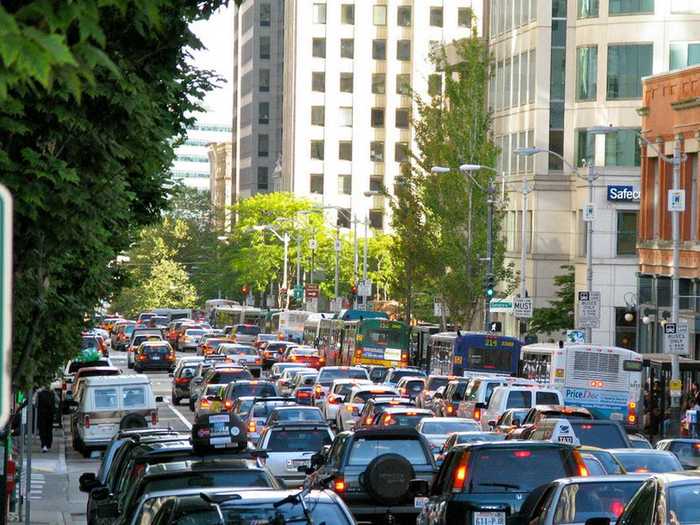
In the state of Washington, transportation spending totaled just over $3,175 annually. Workers — who numbered 3,566,785 — experienced commutes lasting an average of 27.9 minutes.
Drove alone: 71.7%
Carpooled: 10.2%
Public transportation (excluding taxicab): 6.5%
Walked: 3.4%
Other means: 1.8%
Worked from home: 6.3%
Montana: $3,225.21
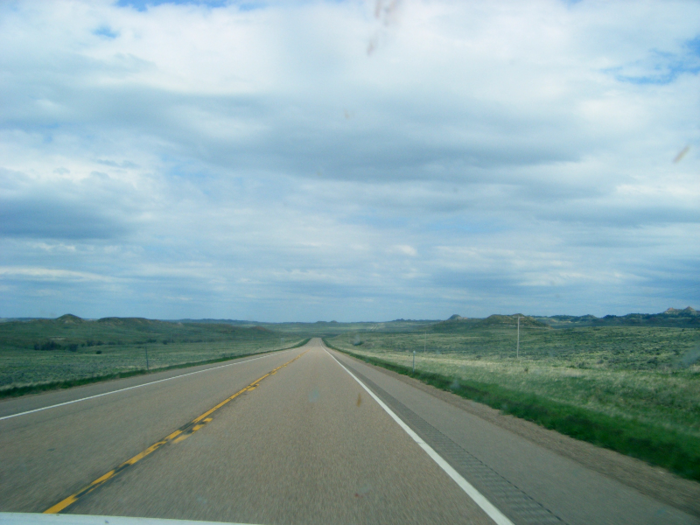
In Montana, transportation spending totaled over $3,200 annually. The state's 508,613 workers' commutes averaged 18.1 minutes.
Drove alone: 76.50%
Carpooled: 8.90%
Public transportation (excluding taxicab): 0.8%
Walked: 4.9%
Other means: 2.3%
Worked from home: 6.5%
Vermont: $3,236.60
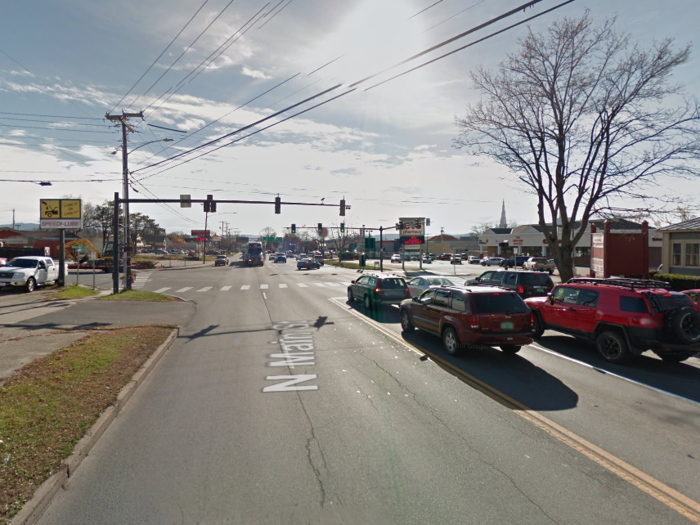
Annual transportation spending in Vermont totaled over $3,200. Vermont's workforce of 318,995 individuals had average commute times of 23.2 minutes.
Drove alone: 74.9%
Carpooled: 9.2%
Public transportation (excluding taxicab): 1.5%
Walked: 5.7%
Other means: 1.6%
Worked from home: 7.1%
Iowa: $3,293.42

Transportation spending in Iowa totaled almost $3,300 annually. Iowa's 1,597,499 workers averaged a 19.4-minute commute.
Drove alone: 81.4%
Carpooled: 8%
Public transportation (excluding taxicab): 0.9%
Walked: 3.2%
Other means: 1.4%
Worked from home: 5.1%
Connecticut: $3,328.18
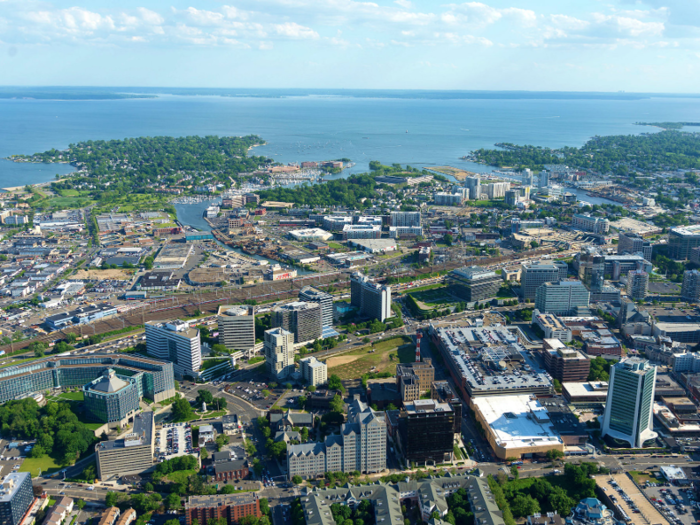
In Connecticut, transportation spending totaled over $3,300 annually. Connecticut's workforce of 778,000 people averaged times of 26.4 minutes.
Drove alone: 78.3%
Carpooled: 7.9%
Public transportation (excluding taxicab): 4.7%
Walked: 2.8%
Other means: 1.3%
Worked from home: 5.1%
California: $3,340.33
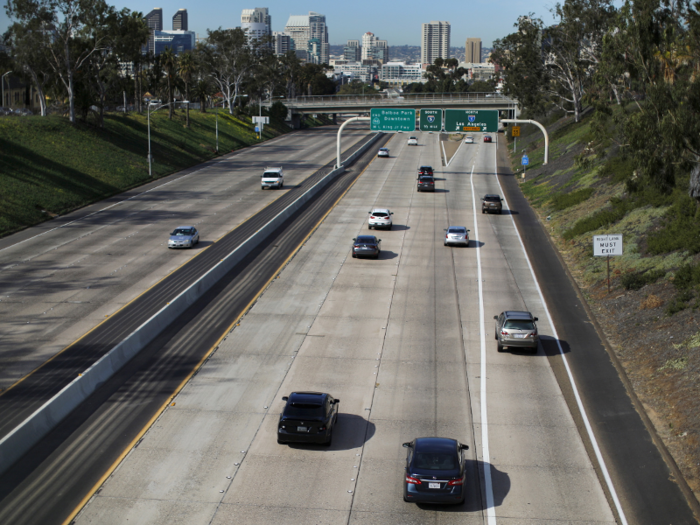
California's annual transportation spending totaled over $3,300. The state boasted a workforce of 18,320,629 people. Despite Los Angeles' notorious traffic, the country's most populous state averaged 29.8 minutes for all areas.
Drove alone: 73.90%
Carpooled: 10%
Public transportation (excluding taxicab): 5%
Walked: 2.6%
Other means: 2.%
Worked from home: 6%
Massachusetts: $3,368.87
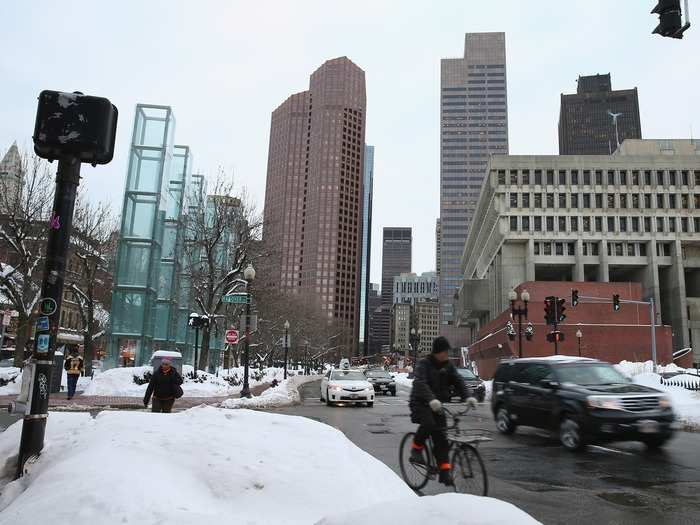
In Massachusetts, transportation spending totaled over $3,300 annually. The state's 3,526,167 people experienced average commute times of 29.8 minutes.
Drove alone: 70%
Carpooled: 7.2%
Public transportation (excluding taxicab): 10.4%
Walked: 4.8%
Other means: 2.2%
Worked from home: 5.3%
New Jersey: $3,519.25
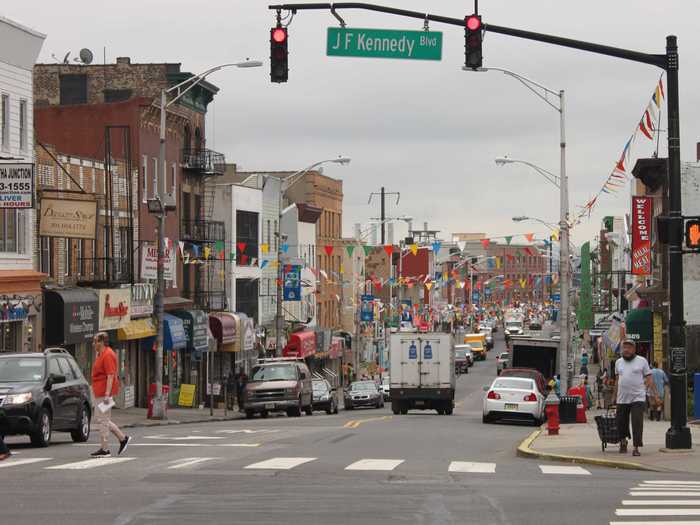
Annual transportation spending in New Jersey totaled over $3,500. The state's 4,409,601 averaged a commute time of 32.1 minutes over the course of the year.
Drove alone: 71%
Carpooled: 7.9%
Public transportation (excluding taxicab): 11.8%
Walked: 2.9%
Other means: 1.8%
Worked from home: 4.6%
South Dakota: $3,597.75
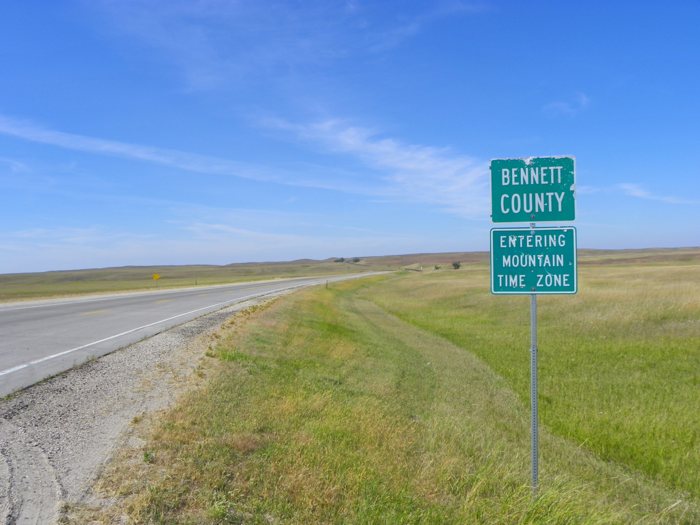
Transportation spending totaled close to $3,600 annually in South Dakota. Commutes averaged 17.3 minutes daily. Along with a slightly longer average, the state had roughly 30,000 more workers than its northern counterpart with a total of 436,376.
Drove alone: 81.2%
Carpooled: 7.8%
Public transportation (excluding taxicab): 0.7%
Walked: 3.4%
Other means: 1%
Worked from home: 5.8%
New Hampshire: $3,601.70
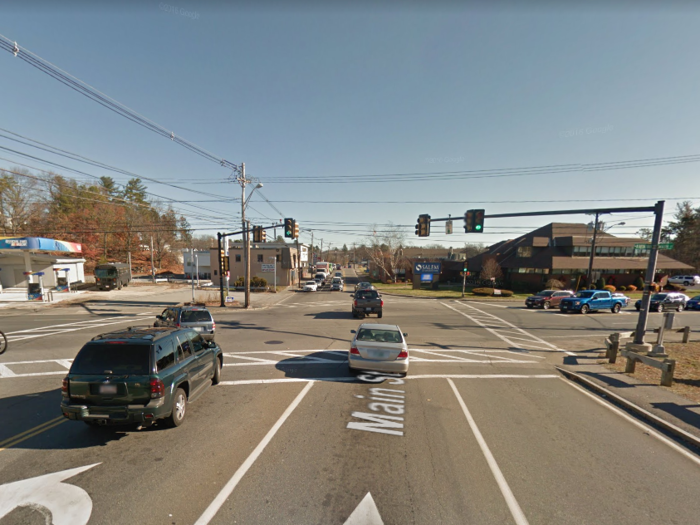
Transportation spending in New Hampshire totaled just over $3,600 annually. The workforce numbered just 712,701, and the workers' average commute time totaled 27.3 minutes.
Drove alone: 80.9%
Carpooled: 8.3%
Public transportation (excluding taxicab): 0.7%
Walked: 2.4%
Other means: 1.4%
Worked from home: 6.2%
Nebraska: $3,623.30
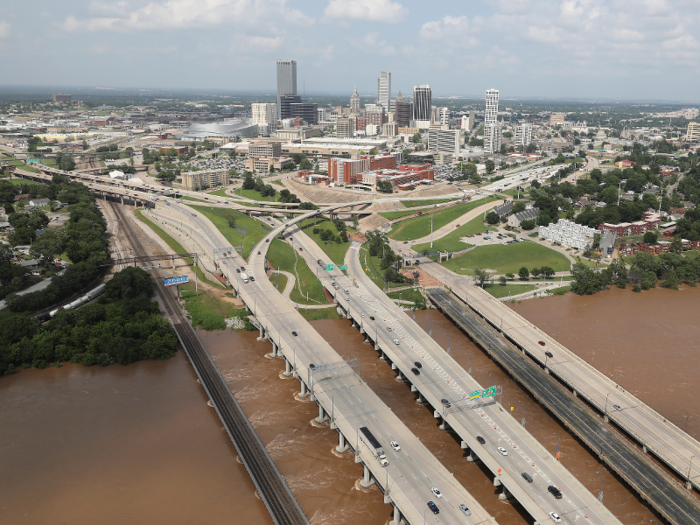
Nebraska's transportation spending totaled over $3,600 annually. The state's workforce of 996,639 individuals experienced average commute times of 18.5 minutes.
Drove alone: 81.7%
Carpooled: 9.1%
Public transportation (excluding taxicab): 0.7%
Walked: 2.7%
Other means: 1.1%
Worked from home: 4.7%
Michigan: $3,631.39
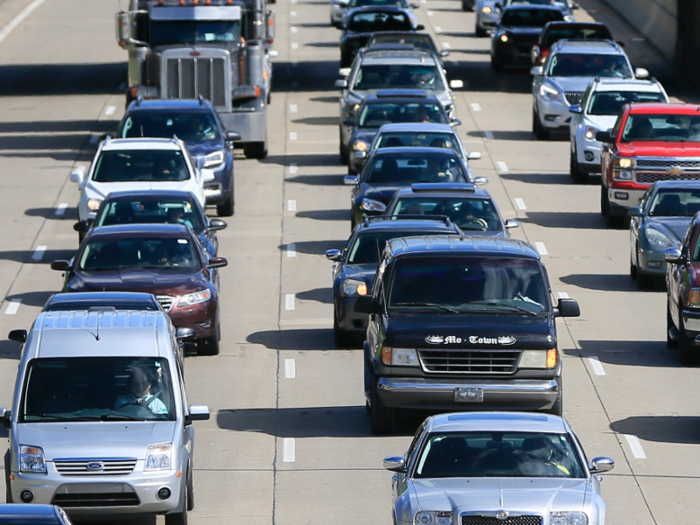
Transportation spending in Michigan totaled over $3,600 annually. Michigan's workforce of 4,560,646 spent 24.3 minutes a day commuting on average.
Drove alone: 82.5%
Carpooled: 8.7%
Public transportation (excluding taxicab): 1.3%
Walked: 2.2%
Other means: 1.2%
Worked from home: 4.2%
Minnesota: $3,660.54

Transportation spending in Minnesota also totaled over $3,600 annually. Minnesota's average commute time totaled 23.8 minutes for its workforce of 2,908,771 people.
Drove alone: 78%
Carpooled: 8.2%
Public transportation (excluding taxicab): 3.7%
Walked: 2.6%
Other means: 1.6%
Worked from home: 5.9%
New York: $3,710.71
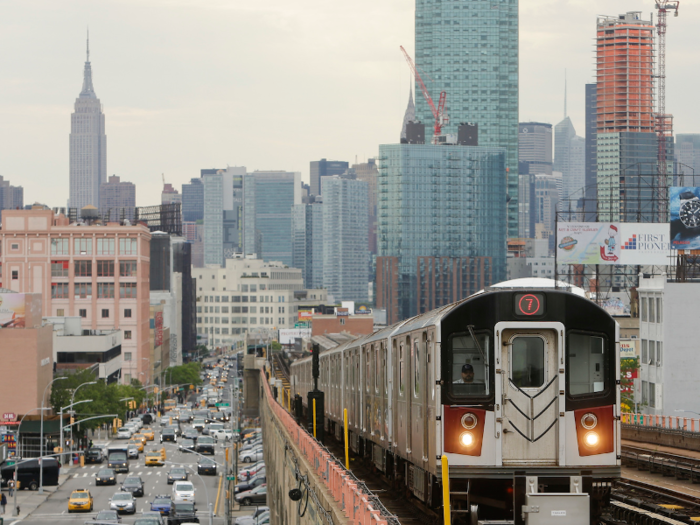
In New York, transportation spending totaled over $3,700 annually. New York's 9,427,680 workers spent 33.7 minutes traveling each day over the course of the year. The state also boasted the second-highest percentage of those who use public transportation.
Drove alone: 53.1%
Carpooled: 6.3%
Public transportation (excluding taxicab): 28.1%
Walked: 6.2%
Other means: 2%
Worked from home: 4.3%
Wyoming: $4,393.40
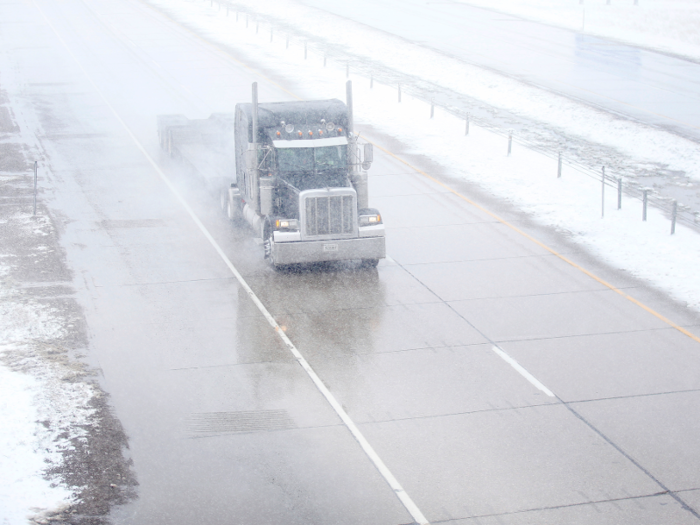
Transportation spending totaled close to $4,400 annually in Wyoming. The United States' least populated state also had the least number of workers, totaling 279,145. Average commute times for these working adults was 17.6 minutes.
Drove alone: 77.9%
Carpooled: 10.2%
Public transportation (excluding taxicab): 0.6%
Walked: 3.6%
Other means: 2.4%
Worked from home: 5.3%
North Dakota: $5,059.11
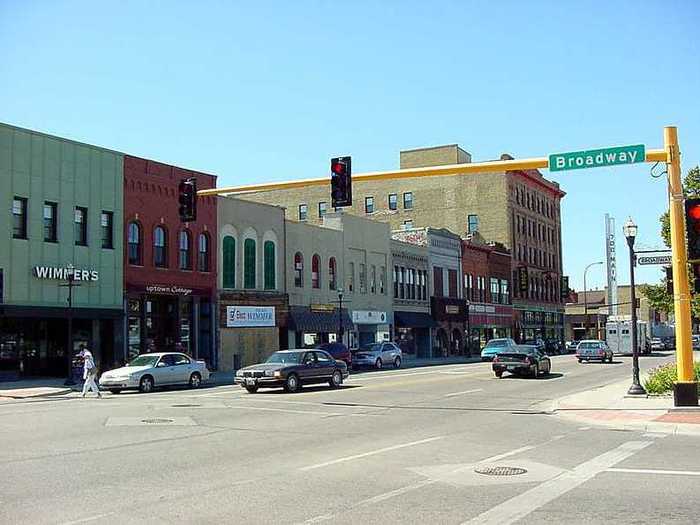
Finally, transportation spending in North Dakota totaled over $5,000 annually. Daily commutes averaged 16.5 minutes, and the sparsely-populated state had 405,145 workers.
Drove alone: 81.6%
Carpooled: 8.2%
Public transportation (excluding taxicab): 0.5%
Walked: 3.8%
Other means: 1.2%
Worked from home: 4.6%
Popular Right Now
Popular Keywords
Advertisement