scorecard6 maps showing the unemployment rate, GDP, and wage growth in every state paint a clear picture of the American economy right now
  1. Home
  2. slideshows
  3. miscellaneous
  4. 6 maps showing the unemployment rate, GDP, and wage growth in every state paint a clear picture of the American economy right now

6 maps showing the unemployment rate, GDP, and wage growth in every state paint a clear picture of the American economy right now

Hawaii had the lowest April 2018 unemployment rate of 2.0%, while Alaska's 7.3% rate was the highest.

6 maps showing the unemployment rate, GDP, and wage growth in every state paint a clear picture of the American economy right now

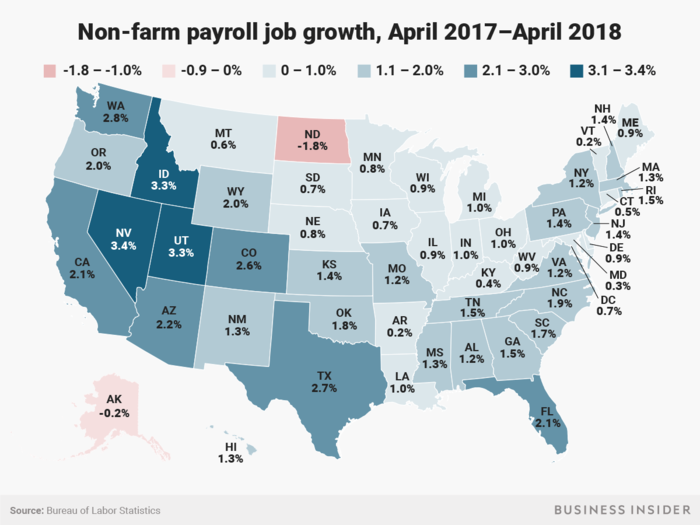
Non-farm payroll job growth rates between April 2017 and April 2018 ranged from North Dakota's 1.8% decline to Nevada's 3.4% increase.

Non-farm payroll job growth rates between April 2017 and April 2018 ranged from North Dakota

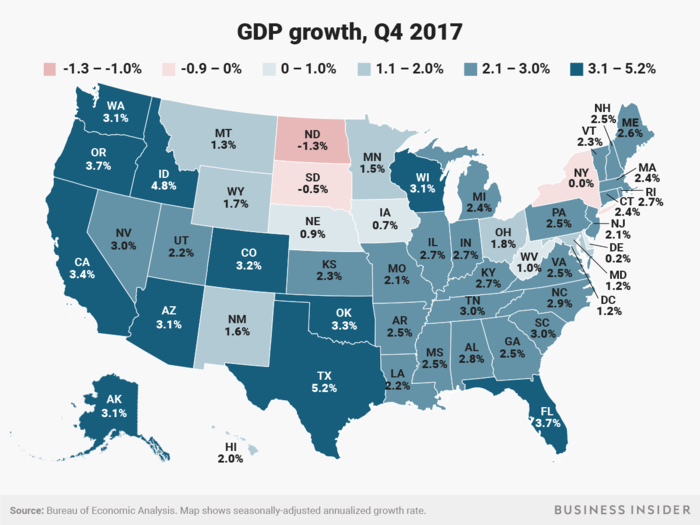
North Dakota's state gross domestic product (GDP) fell 1.3% at an annualized rate in Q4 2017, while Texas' grew 5.2%.

North Dakota

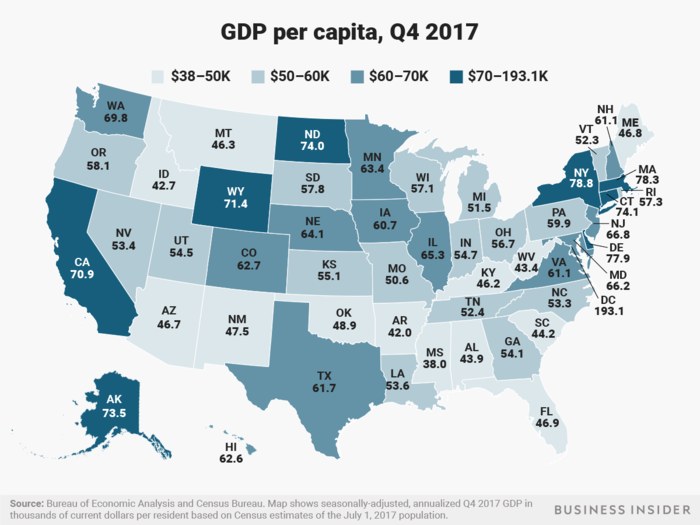
Mississippi had the lowest Q4 2017 GDP per capita at about $38,000, while the District of Columbia's GDP per capita was a whopping $193,000.

Mississippi had the lowest Q4 2017 GDP per capita at about $38,000, while the District of Columbia

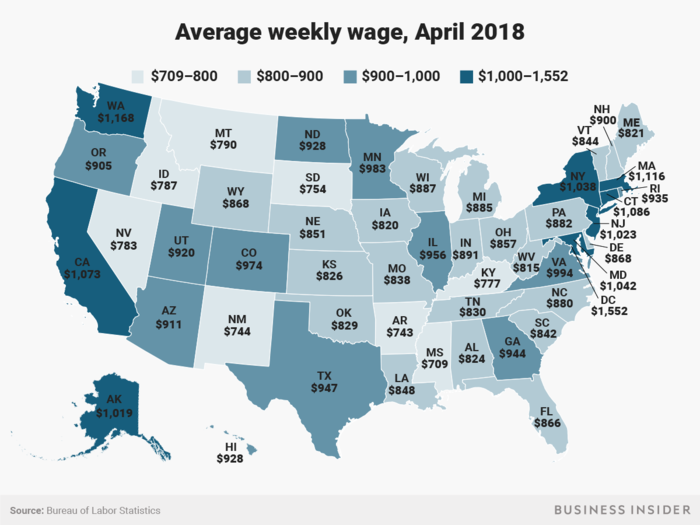
Mississippi also had the lowest April 2018 average weekly wage among the states and DC, at $709, and the District of Columbia also had the highest wage at $1,552.

Mississippi also had the lowest April 2018 average weekly wage among the states and DC, at $709, and the District of Columbia also had the highest wage at $1,552.

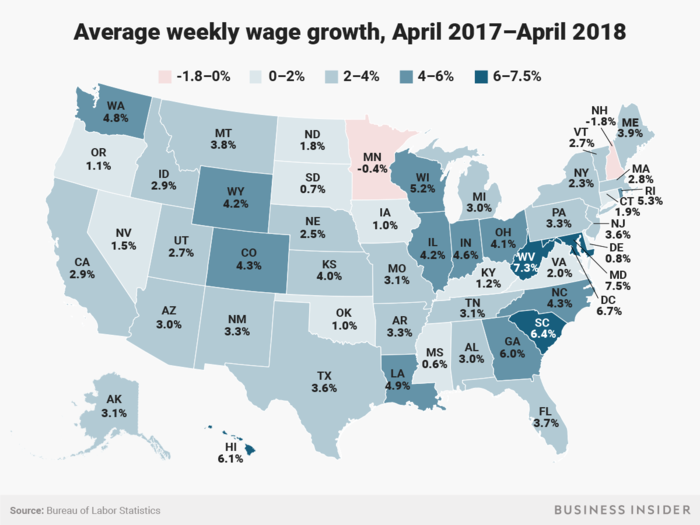
Wage growth between April 2017 and April 2018 ranged from New Hampshire's 1.8% decline to Maryland's 7.5% increase.

Wage growth between April 2017 and April 2018 ranged from New Hampshire

Advertisement