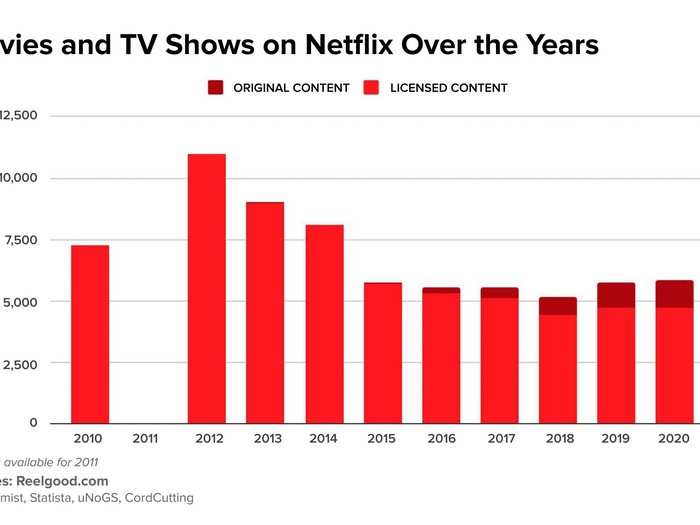
Netflix's library peaked in 2012 with more than 11,000 total titles, even though its original content was nonexistent at the time. Its total number of titles has remained steady since 2015 while its original content has increased.
2010: 7,285 total movies and TV shows
2011: N/A
2012: 11,000
2013: 9,000 (8 originals)
2014: 8,103 (17 originals)
2015: 5,769 (82 originals)
2016: 5,532 (235 originals)
2017: 5,553 (458 originals)
2018: 5,158 (756 originals)
2019: 5,769 (1067 originals)
2020 (so far): 5,838 (1097 originals)
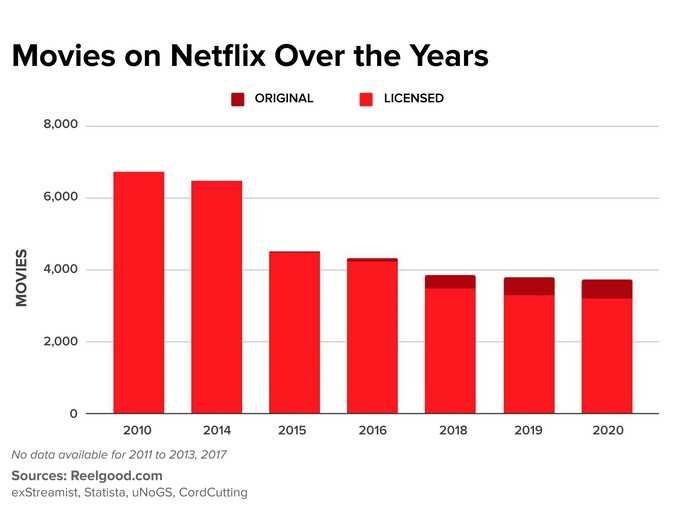
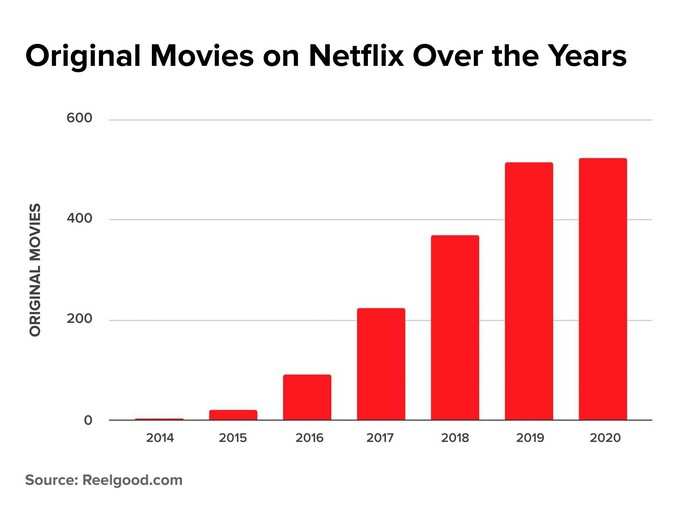
Netflix's total number of movies has decreased every year that Reelgood was able to measure in the last decade, but its number of original movies has increased.
2010: 6,755 total movies
2011: N/A
2012: N/A
2013: N/A
2014: 6,494 (3 original movies)
2015: 4,526 (21 original movies)
2016: 4,335 (92 original movies)
2017: N/A (224 original movies)
2018: 3,857 (370 original movies)
2019: 3,803 (516 original movies)
2020 (so far): 3,730 (523 original movies)
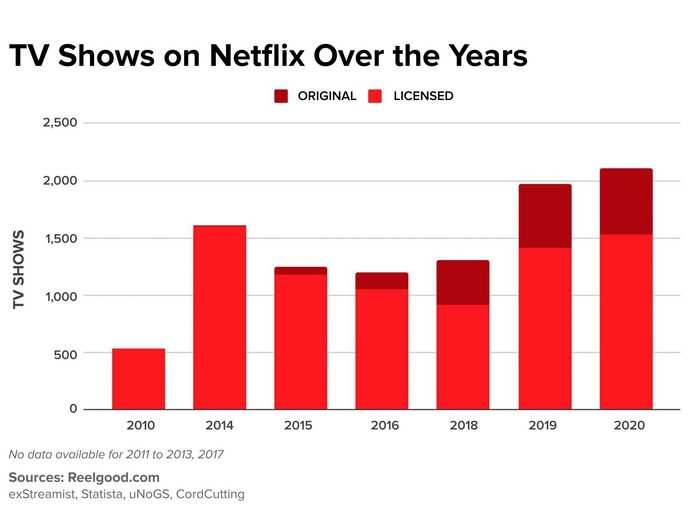
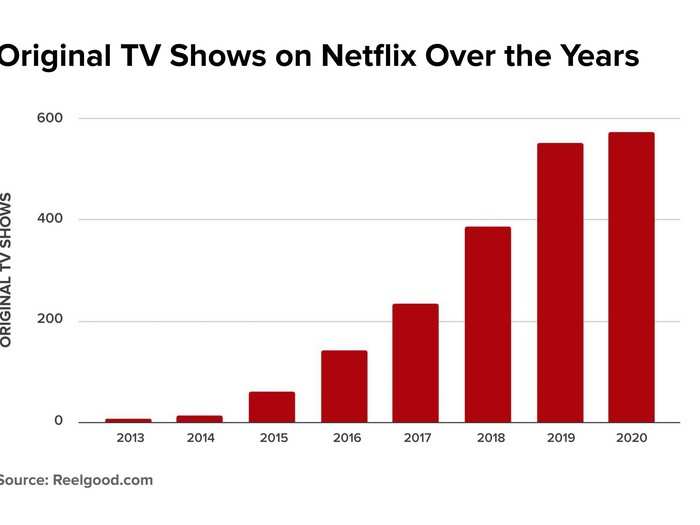
While its number of movies has decreased, Netflix's total number of TV shows has increased in the last few years.
2010: 7,285 total shows)
2011: N/A
2012: N/A
2013: N/A (8 original shows)
2014: 1,609 (14 original shows)
2015: 1,243 (61 original shows)
2016: 1,197 (143 original shows)
2017: N/A (234 original shows)
2018: 1,301 (386 original shows)
2019: 1,966 (551 original shows)
2020 (so far): 2,108 (574 original shows)

