- Home
- slideshows
- miscellaneous
- 25 jobs once considered only for men that are now hiring tons of women
25 jobs once considered only for men that are now hiring tons of women
25. Construction and maintenance painters saw a 30% growth in employment between 2014 and 2018.

24. Physical therapist assistants and aides saw a 31% growth in employment between 2014 and 2018.
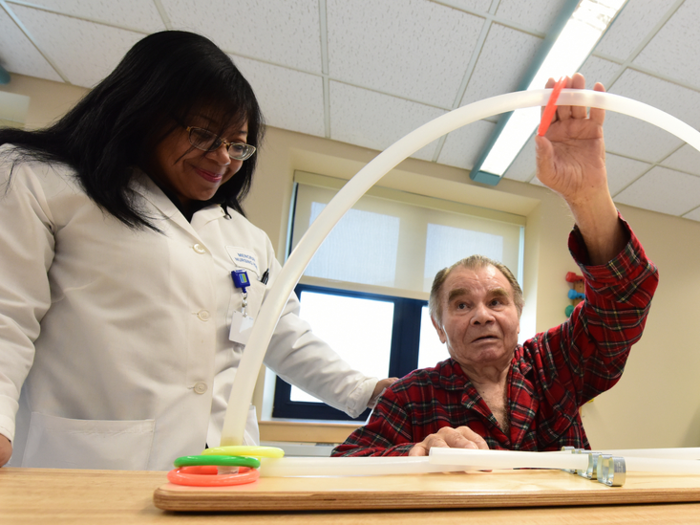
Women employed in 2014: 45,200
Women employed in 2018: 59,300
What they do, according to O*NET: Physical therapist assistants and aides are trained in physical therapy for patients who have trouble moving or are recovering from an injury. They assist a physical therapist with treatment plans, and document the progress of the patient's recovery.
23. Freight, stock, and material movers and laborers saw a 32% growth in employment between 2014 and 2018.
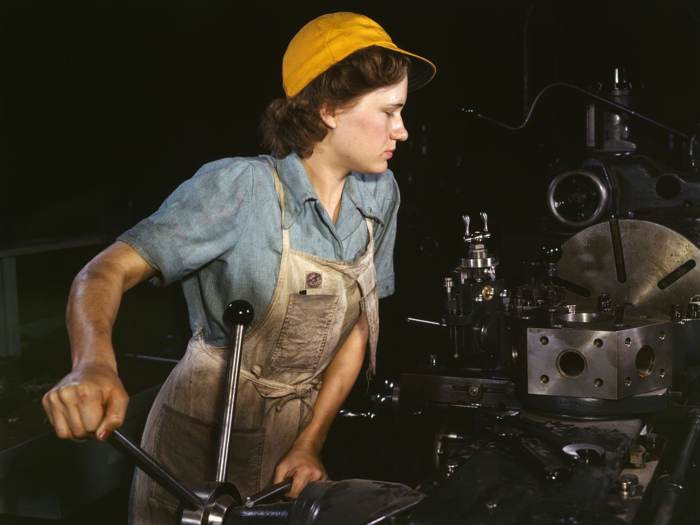
Women employed in 2014: 341,700
Women employed in 2018: 450,700
What they do, according to O*NET: Freight, stock, and material movers perform manual labor to move any stock necessary.
T21. Software developers (application systems software) saw a 33% growth in employment between 2014 and 2018.

Women employed in 2014: 244,500
Women employed in 2018: 324,600
What they do, according to O*NET: Software developers create computer software and analyze users' needs to fix software issues. They may also supervise computer programmers to make sure the software works effectively.
T21. Police and sheriff's patrol officers saw a 33% growth in employment between 2014 and 2018.

Women employed in 2014: 84,300
Women employed in 2018: 112,100
What they do, according to O*NET: Police and sheriff's patrol officers protect citizens by enforcing local, state, federal, or tribal laws.
20. Pharmacists saw a 34% growth in employment between 2014 and 2018.

Women employed in 2014: 165,000
Women employed in 2018: 220,600
What they do, according to O*NET: Pharmacists give out prescription drugs to patients, and give information to patients about medications and how to use them.
19. Database administrators saw a 35% growth in employment between 2014 and 2018.
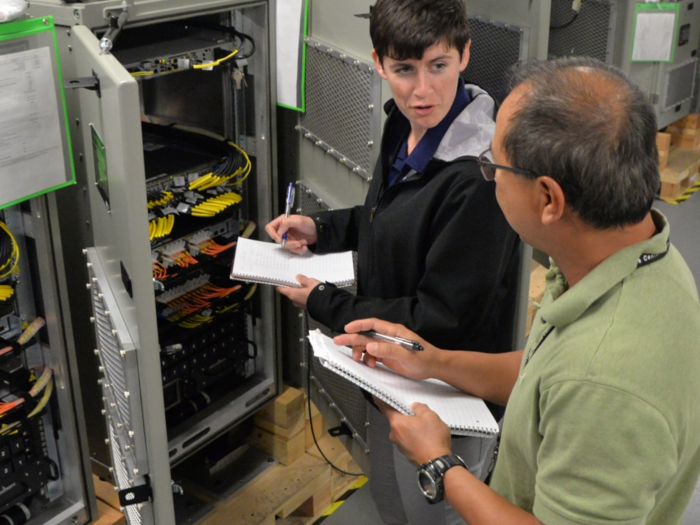
Women employed in 2014: 30,200
Women employed in 2018: 40,900
What they do, according to O*NET: Database administrators implement computer databases and coordinate changes to those databases.
T17. Compliance officers saw a 36% growth in employment between 2014 and 2018.

Women employed in 2014: 110,900
Women employed in 2018: 150,900
What they do, according to O*NET: Compliance officers make sure companies are following outside regulations by looking at employees' performance compared with existing guidelines.
T17. Mechanical engineers saw a 36% growth in employment between 2014 and 2018.

Women employed in 2014: 26,700
Women employed in 2018: 36,300
What they do, according to O*NET: Mechanical engineers design tools, engines, and other machines. They may also install equipment like centralized heat, gas, and water systems.
16. Supervisors of transportation and material moving workers saw a 38% growth in employment between 2014 and 2018.

Women employed in 2014: 36,400
Women employed in 2018: 50,300
What they do, according to O*NET: Supervisors of transportation and material moving workers review orders and production schedules to make sure shipments and products are coming in on time and are handled efficiently.
T14. Food servers (non-restaurant) saw a 39% growth in employment between 2014 and 2018.

Women employed in 2014: 114,500
Women employed in 2018: 158,700
What they do, according to O*NET: Food servers typically work in cafeterias, hotels, or hospitals, as opposed to restaurant food servers who wait tables.
T14. Human resources managers saw a 39% growth in employment between 2014 and 2018.

Women employed in 2014: 175,600
Women employed in 2018: 243,800
What they do, according to O*NET: Human resources managers serve as a link between management and employees in many companies by answering questions, letting employees voice their concerns, and administering contracts.
13. Computer systems analysts saw a 40% growth in employment between 2014 and 2018.

Women employed in 2014: 174,800
Women employed in 2018: 244,500
What they do, according to O*NET: Computer systems analysts look at data to improve computer system performance. They also look at user requirements, system capabilities, and workflow to upgrade systems.
12. Reservation and transportation ticket agents and travel clerks saw a 41% growth in employment between 2014 and 2018.

Women employed in 2014: 54,000
Women employed in 2018: 76,000
What they do, according to O*NET: Reservation and transportation ticket agents make reservations for customers at hotels or for transportation, and may also help tourists by giving them information.
11. Chemists and materials scientists saw a 46% growth in employment between 2014 and 2018.

Women employed in 2014: 30,400
Women employed in 2018: 44,500
What they do, according to O*NET: Chemists and materials scientists research the chemical properties of natural or synthetic materials, like metal, rubber, ceramics, plastics, or glass.
10. Non-farm animal caretakers saw a 48% growth in employment between 2014 and 2018.

Women employed in 2014: 140,500
Women employed in 2018: 208,000
What they do, according to O*NET: Non-farm animal caretakers care for pets like dogs or cats in kennels. They may also work in zoos or aquariums, where they take care of more exotic animals.
9. Construction managers saw a 49% growth in employment between 2014 and 2018.

Women employed in 2014: 52,600
Women employed in 2018: 78,600
What they do, according to O*NET: Construction managers oversee construction workers to make sure they're completing projects on time and in a safe environment. They also contribute to the overall construction scheduling and plan with contractors.
8. Physician assistants saw a 52% growth in employment between 2014 and 2018.
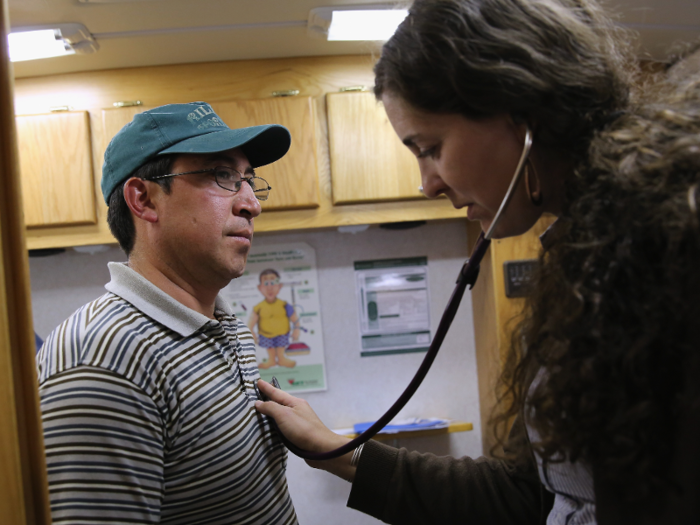
Women employed in 2014: 62,600
Women employed in 2018: 95,200
What they do, according to O*NET: Physician assistants provide healthcare services under the supervision of a physician, like physicals, treatment, or counseling.
T6. Architects (except naval) saw a 58% growth in employment between 2014 and 2018.

Women employed in 2014: 45,000
Women employed in 2018: 71,000
What they do, according to O*NET: Architects plan and design structures like office buildings, factories, houses, and other buildings.
T6. Nurse practitioners saw a 58% growth in employment between 2014 and 2018.

Women employed in 2014: 117,100
Women employed in 2018: 184,900
What they do, according to O*NET: Nurse practitioners diagnose and treat illnesses in a clinic or hospital. They may also perform diagnostic tests like lab work or x-rays.
5. Veterinarians saw a 60% growth in employment between 2014 and 2018.

Women employed in 2014: 45,500
Women employed in 2018: 72,600
What they do, according to O*NET: Veterinarians diagnose and treat diseases or injuries in animals. They may also research diseases to prevent them, promoting animal health.
4. Couriers and messengers saw a 66% growth in employment between 2014 and 2018.

Women employed in 2014: 37,300
Women employed in 2018: 61,800
What they do, according to O*NET: Couriers and messengers pick up and deliver messages or other objects, like documents or food, via car, bicycle, or walking.
3. Industrial engineers, including health and safety, saw an 82% growth in employment between 2014 and 2018.

Women employed in 2014: 31,000
Women employed in 2018: 56,600
What they do, according to O*NET: Industrial engineers design and test industrial production methods, making sure human work factors and quality control are taken into account.
2. Construction laborers saw an 85% growth in employment between 2014 and 2018.

Women employed in 2014: 42,200
Women employed in 2018: 78,100
What they do, according to O*NET: Construction laborers build structures on construction sites, operating heavy machinery like power tools. They may also operate larger vehicles like bulldozers or cranes.
1. Taxi drivers and chauffeurs saw a 188% growth in employment between 2014 and 2018.

Women employed in 2014: 48,600
Women employed in 2018: 139,900
What they do, according to O*NET: Taxi drivers and chauffeurs drive passengers around, either through a taxi or limousine service, or through a ride-hailing platform like Uber or Lyft.
Popular Right Now
Popular Keywords
Advertisement