Stunning maps show what major cities would look like under hundreds of feet of water
Seattle was the first sea-level rise map Linn made, completed in December 2013. He was inspired to start the map by a blogger who writes under the name Burrito Justice. "He did a 200-foot sea-level rise map for San Francisco, and I was like, 'I have to do this for Seattle,'" Linn says.

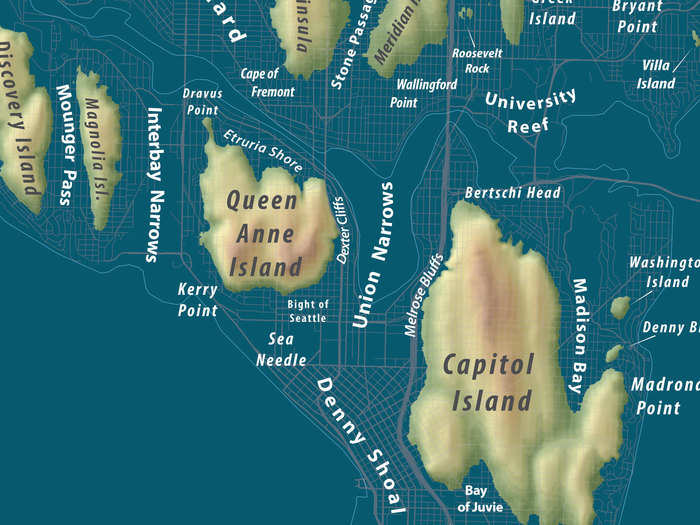
The result is striking — after 240 feet of sea-level rise, Seattle is reduced to a collection of small islands, like these three, which emerged in the area near the place Seattle's iconic space needle stands today. (The needle, in this map, is sadly submerged.)
Linn uses open-source data to create most of the maps. He puts the data together using a mapping program called QGIS, and then assembles everything in Adobe Illustrator. He says the base cartography only takes him a few hours.
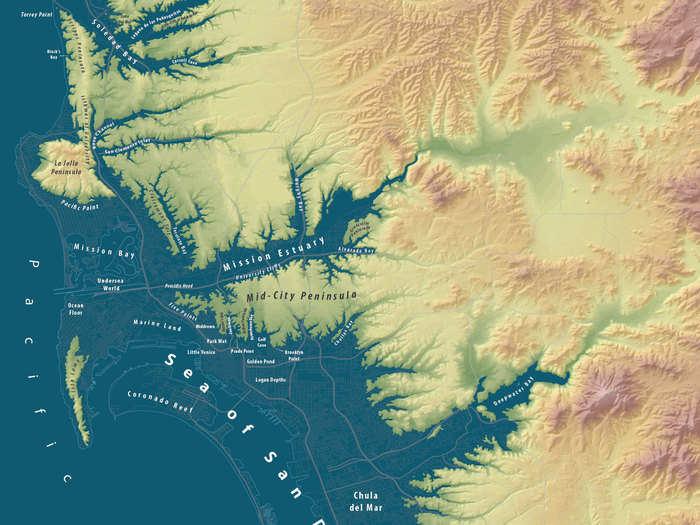
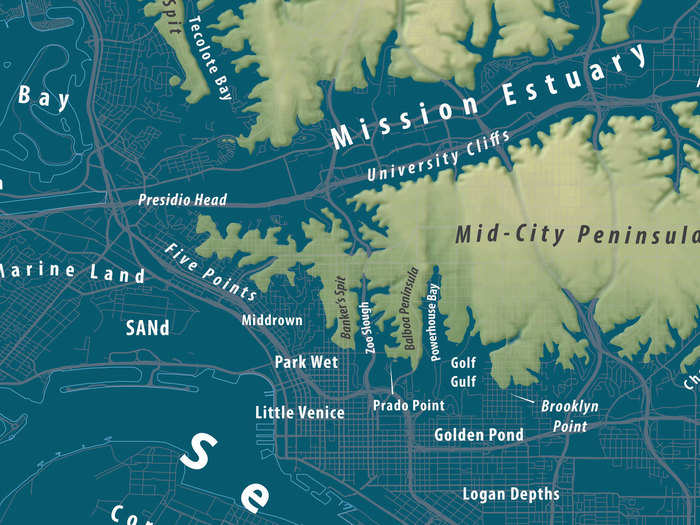
As shown in this close-up of San Diego, the maps are detailed right down to the city streets that will be submerged under the rising sea. Here, you can see the feathery "Mid-City Peninsula" that emerges in the middle of San Diego, and the surrounding submerged street map.
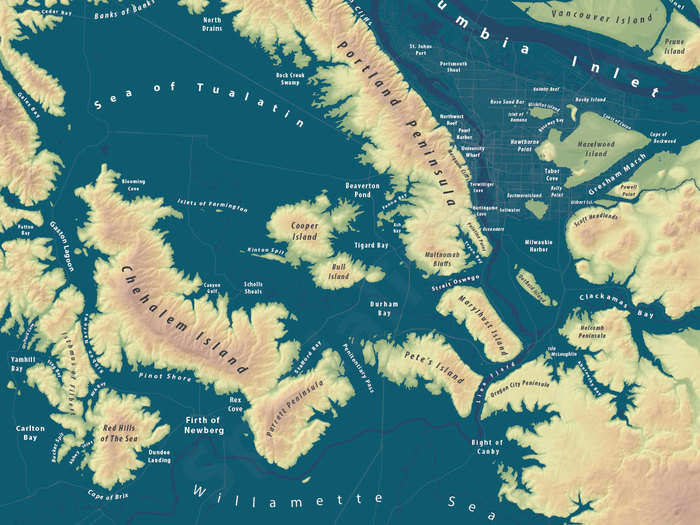
Linn says what fascinates him most about the maps are the interesting landforms that emerge, like the islands that jump out of this Portland map. "I love cities, and just to see how this is going to affect all the world’s cities — the coastal cities, anyway — is fascinating," he says.
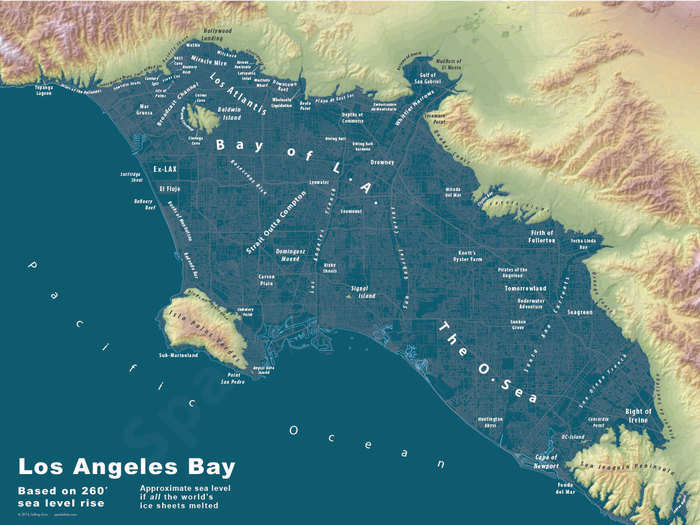
Linn also creates his own names for the new landforms, such as islands and inlets, that emerge in his maps. This part takes the most time, but is also the most fun, he says. He spent several weeks working on the labels for this map of Los Angeles after 260 feet of sea-level rise.
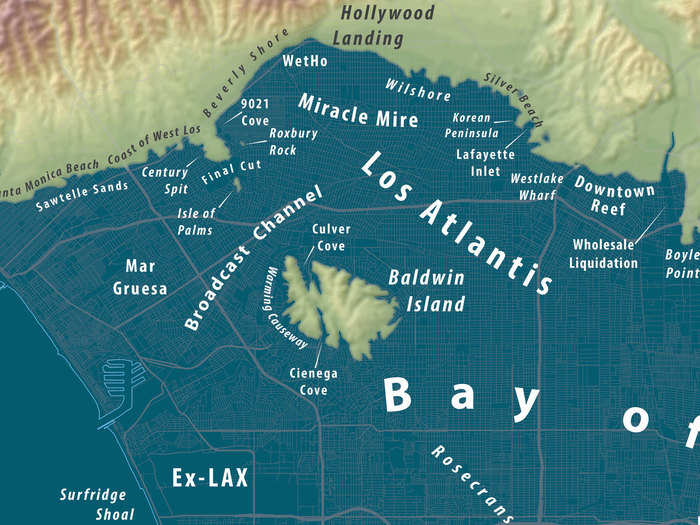
This close-up showcases Linn's attention to detail. Even minute details that emerge on the map, such as "Lafayette Inlet" and "Boyle Point," are named.
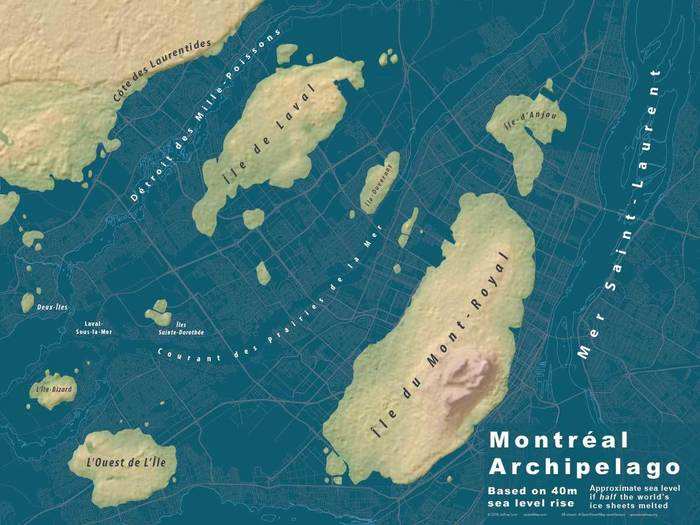
For some of the maps, Linn used a lower level of sea-level rise than the full 80 meters. He did this in order to achieve the most interesting effects in his maps. "Montreal I did at 40 meters instead of the full 80 meters because, basically, Montreal becomes a big sheet of blue at the full height and that’s not very interesting," he says. But at 40 meters, instead of being totally submerged, Montreal becomes an interesting collection of islands.
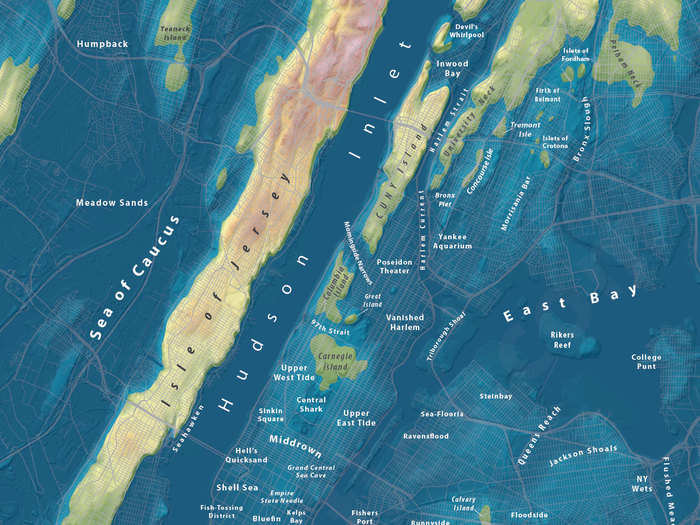
New York City is a similar story. Even after only 100 feet of sea-level rise, the island of Manhattan is almost totally submerged. Brooklyn and Queens are reduced to a handful of small islands. And the iconic Statue of Liberty? Washed away.
Some of the maps yielded surprising results. Palm Springs is further inland than the other cities Linn has mapped, but it still produced an interesting map. "It’s kind of far from the ocean, but the Imperial Valley and the Coachella Valley are very low and connect right to the Gulf of California," Linn says. After 260 feet of sea-level rise, a large bay appears in the area.
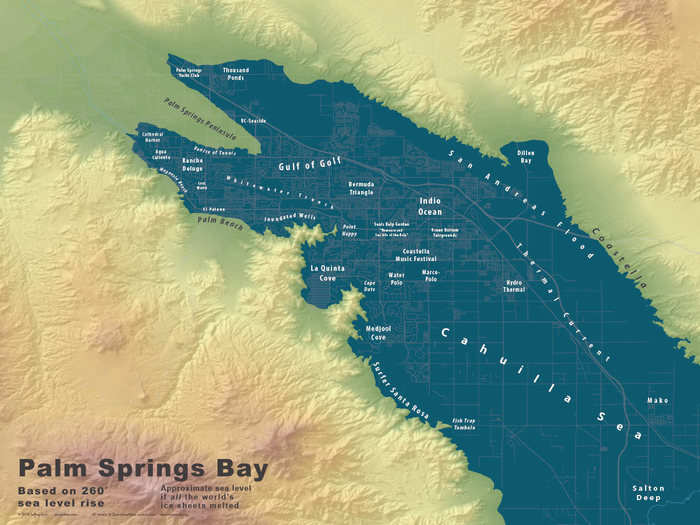
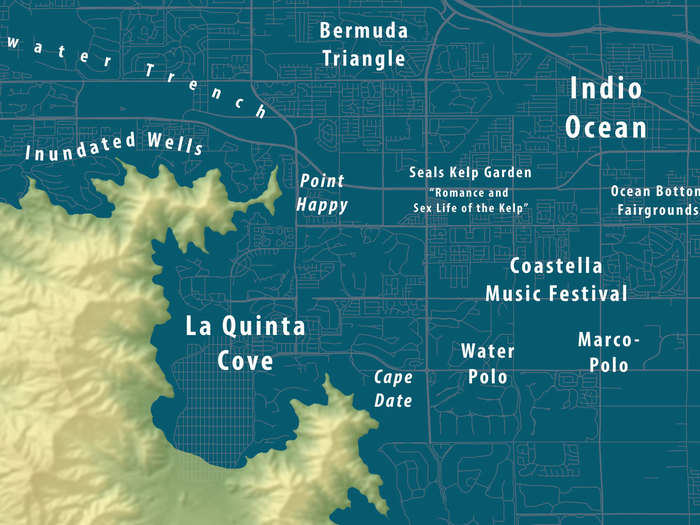
On the shores of that bay, some interesting landforms jump out, like this two spiky peninsulas, shown in close-up here. Meanwhile, you can see that the grounds used to host the famous Coachella Music Festival have been washed away.
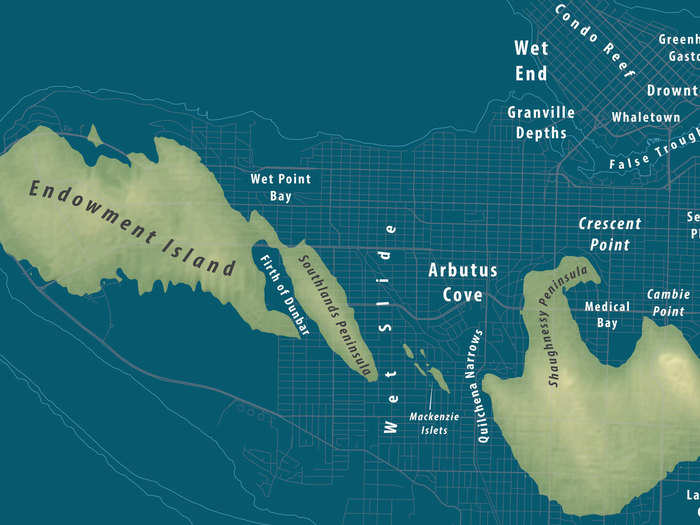
Vancouver's outcome is perhaps less surprising, but no less striking. Linn says he hopes his maps, which show an extreme amount of sea-level rise in comparison to many other sea-level graphics, will capture people's attention in a new way.
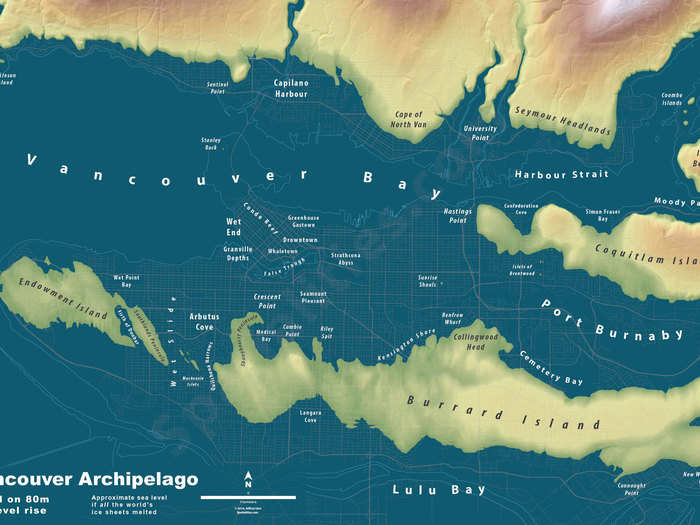
"If we take a look at this real extreme point, and then maybe add some humor to it in the place names, then maybe that will get people’s attention a little more," he says.
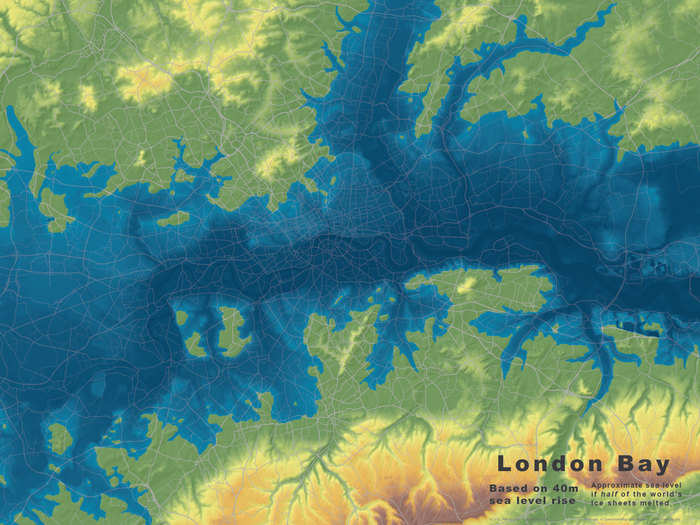
Here's a sneak peek into Linn's work on mapping the UK. While no names have been added yet, this is a map of what London would look like after more than 130 feet of sea-level rise — the outcome if half the world's glaciers melted. Eventually, Linn says he hopes to put together a world atlas. "I’m looking for a publisher or an agent to help me get going on this," he says.
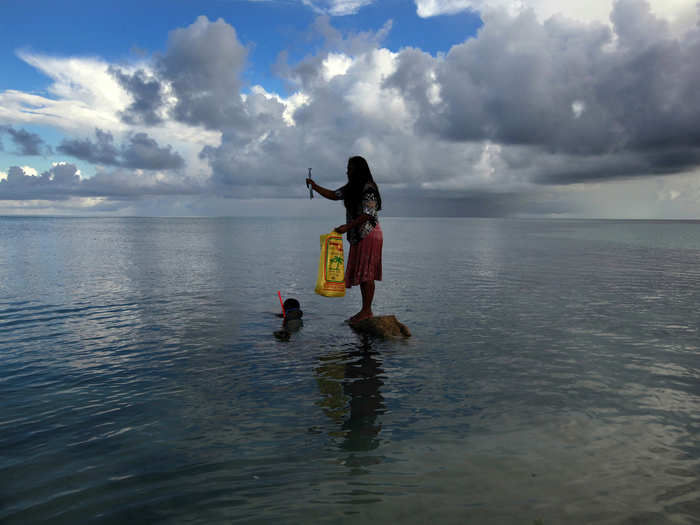
Unfortunately, other places in the world won't even survive a few feet of sea-level rise.
Popular Right Now
Advertisement