Uber and Lyft drivers protested low pay this week. Here are the cities where their earnings have fallen the most.
20. Austin, Texas.

19. Portland, Oregon

2013 to 2018 net change: -21%
18. Chicago, Illinois

2013 to 2018 net change: -23%
17. San Francisco, California

2013 to 2018 net change: -27%
16. San Jose, California

2013 to 2018 net change: -35%
15. New York, New York
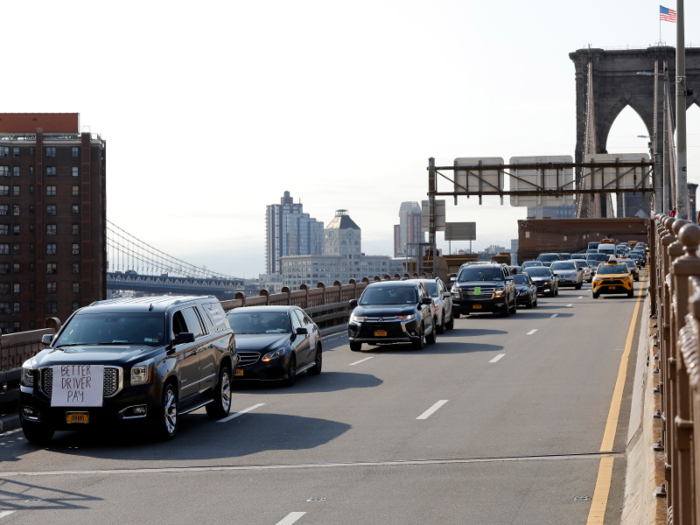
2013 to 2018 net change: -36%
14. Seattle, Washington

2013 to 2018 net change: -43%
13. Detroit, Michigan
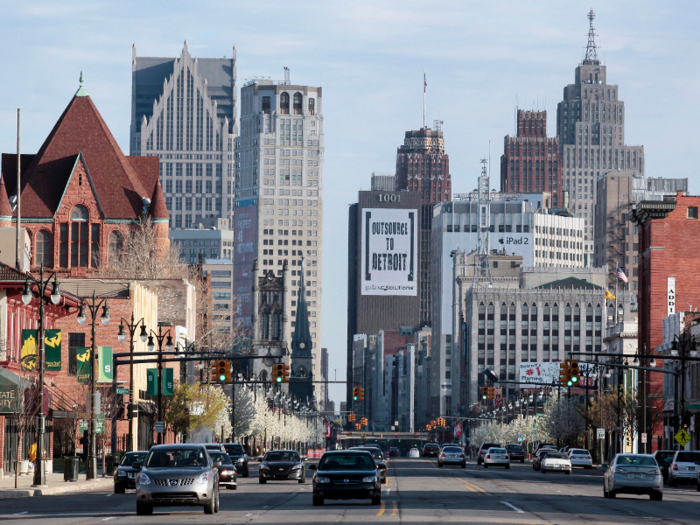
2013 to 2018 net change: -43%
12. Columbus, Ohio

2013 to 2018 net change: -44%
11. Houston, Texas

2013 to 2018 net change: -45%
10.Los Angeles, California

2013 to 2018 net change: -54%
9. Denver, Colorado

2013 to 2018 net change: -58%
8. Indianapolis, Indiana

2013 to 2018 net change: -58%
7. Las Vegas, Nevada

2013 to 2018 net change: -60%
6. San Diego, California
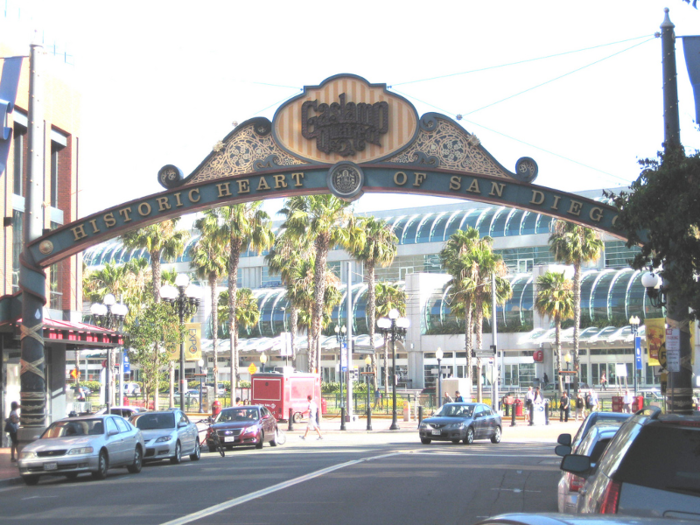
2013 to 2018 net change: -62%
5. Phoenix, Arizona

2013 to 2018 net change: -69%
4. Miami, Florida

2013 to 2018 net change: -71%
3. Dallas, Texas

2013 to 2018 net change: -79%
2. Atlanta, Georgia

2013 to 2018 net change: -80%
1. Bridgeport, Connecticut
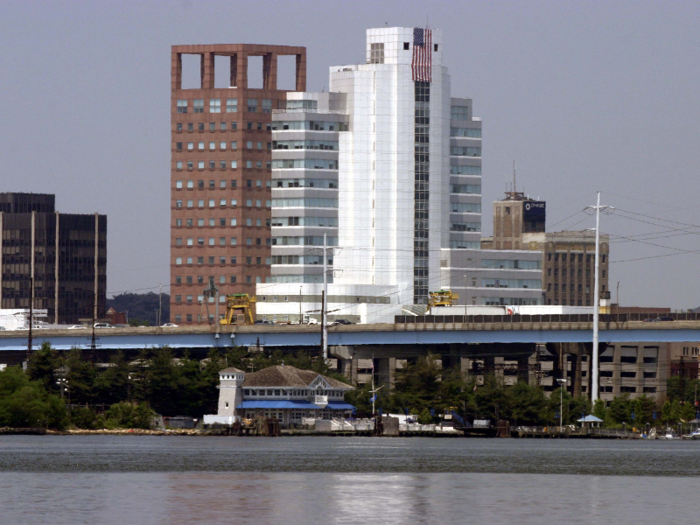
2013 to 2018 net change: -87%
Popular Right Now
Advertisement