scorecardThese 6 maps show how the economies of all 50 US states and DC are doing
  1. Home
  2. slideshows
  3. miscellaneous
  4. These 6 maps show how the economies of all 50 US states and DC are doing

These 6 maps show how the economies of all 50 US states and DC are doing

Alaska's 6.3% unemployment rate in November 2018 was the highest among the states and DC, while Iowa and Hawaii were tied for lowest at 2.4%

These 6 maps show how the economies of all 50 US states and DC are doing

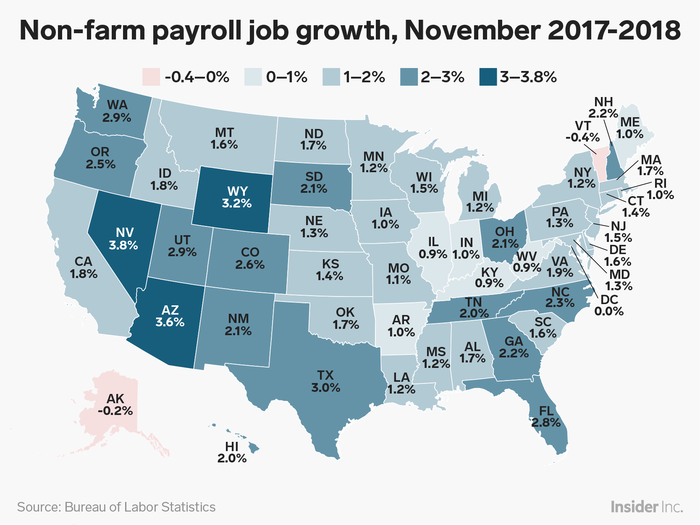
Non-farm payroll job growth ranged from a 0.4% decline in Vermont between November 2017 and November 2018 to a 3.8% increase in Nevada.

Non-farm payroll job growth ranged from a 0.4% decline in Vermont between November 2017 and November 2018 to a 3.8% increase in Nevada.

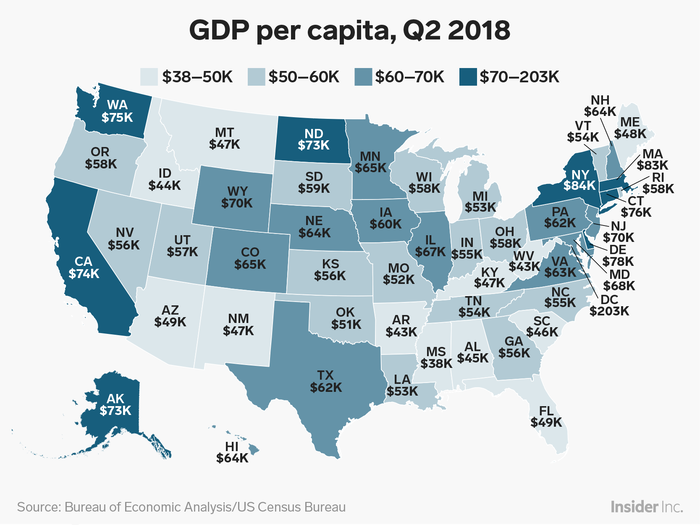
Mississippi's Gross Domestic Product per capita of $37,979 in Q2 2018 was the lowest in the country, while Washington DC's GDP per capita of $202,726 was by far the highest.

Mississippi

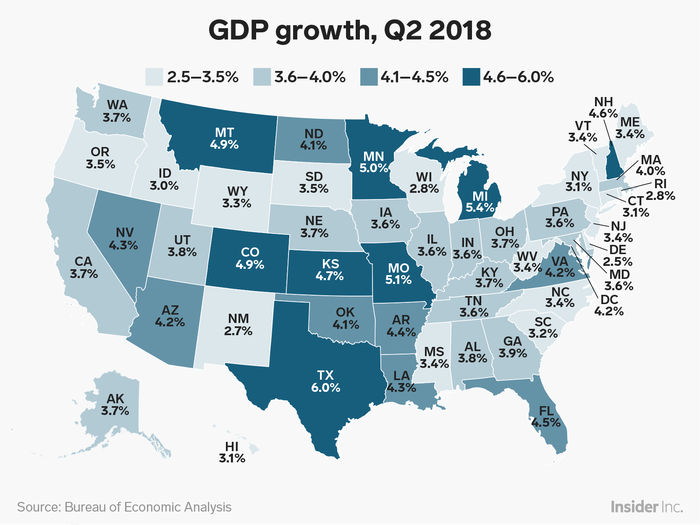
GDP growth in Q2 2018 ranged between just 2.5% in Delaware to 6.0% in Texas.

GDP growth in Q2 2018 ranged between just 2.5% in Delaware to 6.0% in Texas.

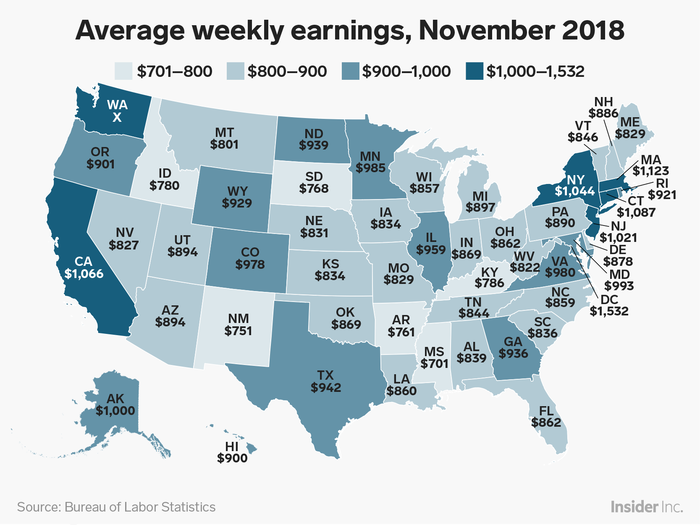
Mississippi had the lowest average weekly earnings in November 2018 among the states and DC at $701, while Washington, DC had the highest wages at $1,532.

Mississippi had the lowest average weekly earnings in November 2018 among the states and DC at $701, while Washington, DC had the highest wages at $1,532.

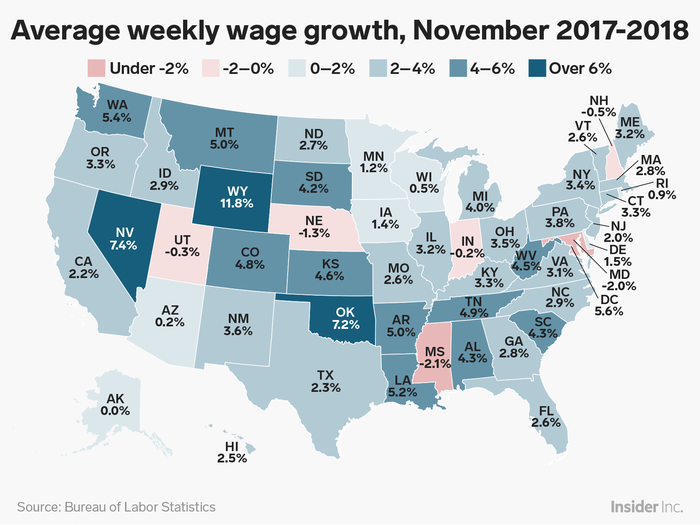
Change in the average weekly wage between November 2017 and November 2018 ranged between a 2.1% decline in Mississippi to a whopping 11.8% increase in Wyoming.

Change in the average weekly wage between November 2017 and November 2018 ranged between a 2.1% decline in Mississippi to a whopping 11.8% increase in Wyoming.

Advertisement