Forget New York - millennials are better off in these 30 US cities, where they're paid well and can afford to buy a home
30. Greendale, Wisconsin (53129)

29. Spokane, Washington (99205)

Median listing price: $172,943
Millennial home ownership rate: 56.7%
2018 millennial median household income: $51,616
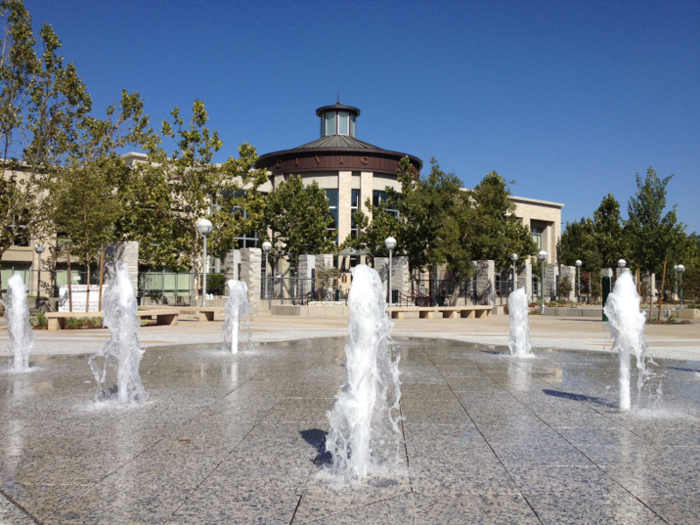
28. Valencia, California (91354)
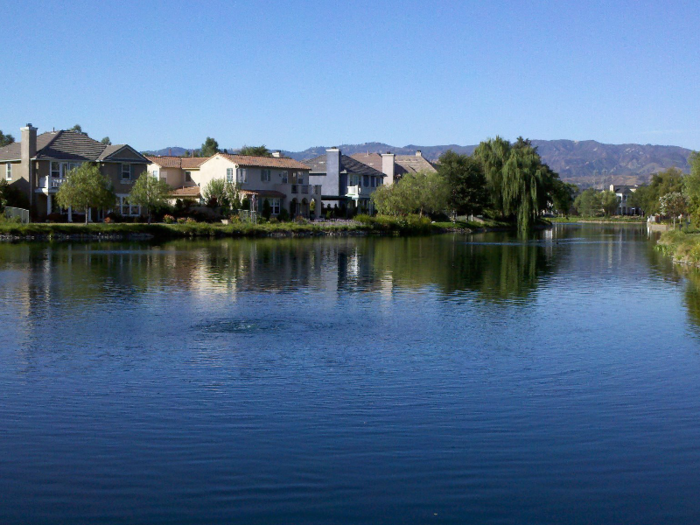
Median listing price: $581,807
Millennial home ownership rate: 56.3%
2018 millennial median household income: $115,694
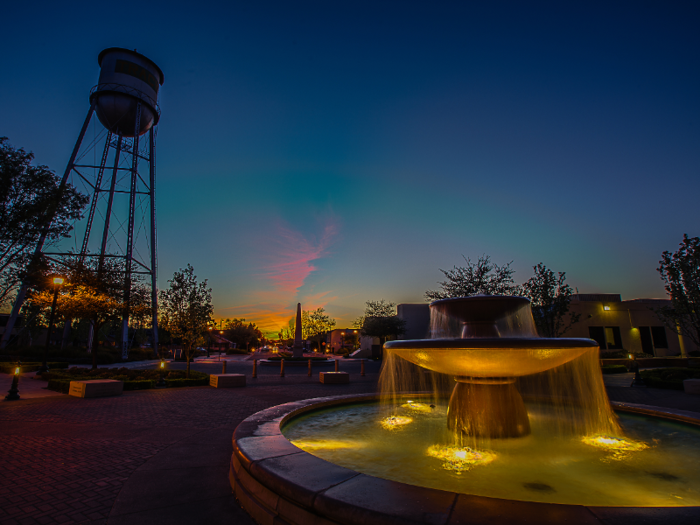
27. Vacaville, California (95687)
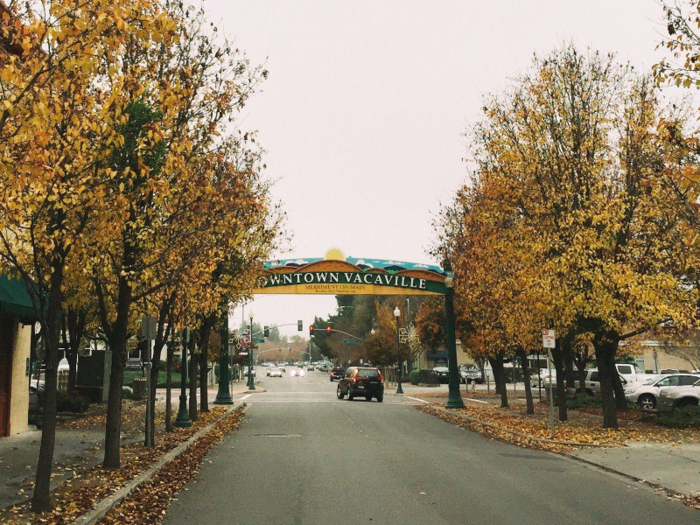
Median listing price: $427,464
Millennial home ownership rate: 40.9%
2018 millennial median household income: $74,923
26. Chandler, Arizona (85224)
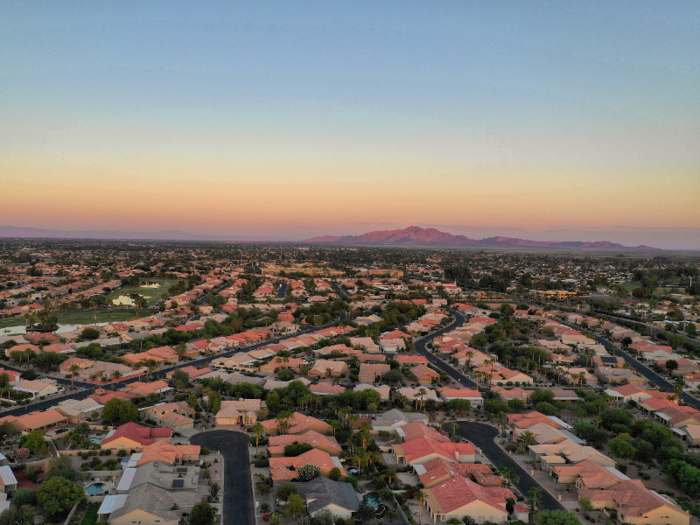
Median listing price: $276,607
Millennial home ownership rate: 38.5%
2018 millennial median household income: $72,007
25. Cincinnati, Ohio (45240)

Median listing price: $132,089
Millennial home ownership rate: 41%
2018 millennial median household income: $51,227
24. Mansfield, Massachusetts (02048)
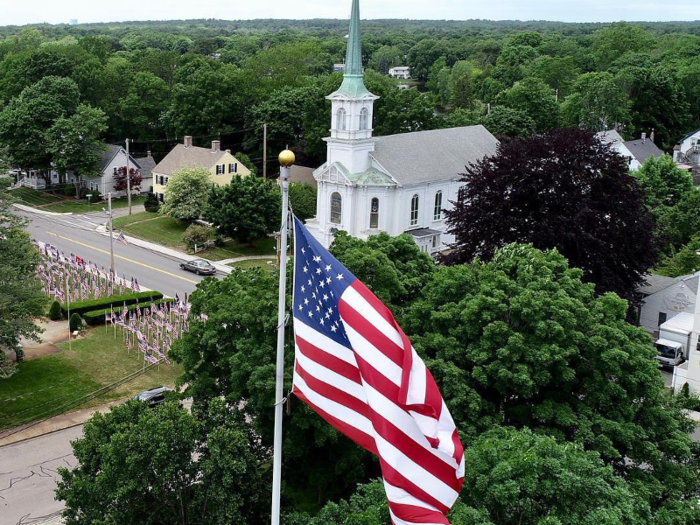
Median listing price: $424,807
Millennial home ownership rate: 47.7%
2018 millennial median household income: $94,886
23. Louisville, Kentucky (40220)

Median listing price: $221,182
Millennial home ownership rate: 40.7%
2018 millennial median household income: $66,266
22. Charlotte, North Carolina (28262)

Median listing price: $219,143
Millennial home ownership rate: 25.2%
2018 millennial median household income: $49,920
21. Nashville, Tennessee (37214)

Median listing price: $256,825
Millennial home ownership rate: 41.7%
2018 millennial median household income: $63,042
20. San Diego, California (92129)

Median listing price: $800,589
Millennial home ownership rate: 46.4%
2018 millennial median household income: $117,308
19. Highland, Indiana (46322)
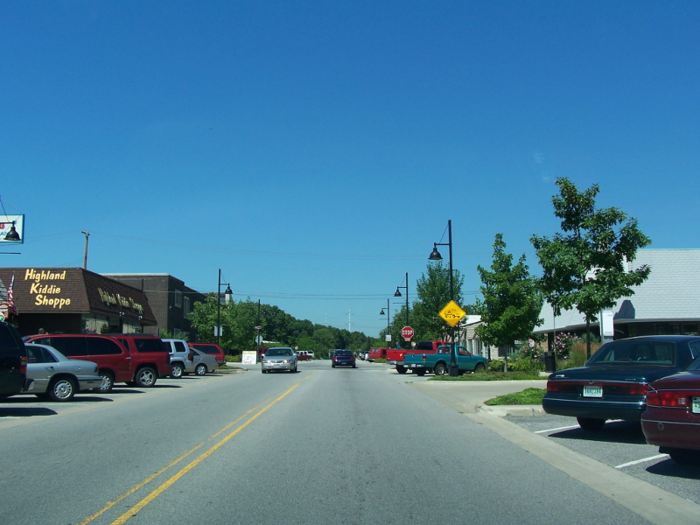
Median listing price: $171,675
Millennial home ownership rate: 58.9%
2018 millennial median household income: $66,551
18. Roseville, California (95678)
Median listing price: $412,056
Millennial home ownership rate: 30.6%
2018 millennial median household income: $71,037
17. Fresno, California (93710)

Median listing price: $263,457
Millennial home ownership rate: 21.5%
2018 millennial median household income: $44,473
16. Fort Wayne, Indiana (46815)
Median listing price: $142,618
Millennial home ownership rate: 62.7%
2018 millennial median household income: $63,227
15. Salt Lake City, Utah (84123)

Median listing price: $303,575
Millennial home ownership rate: 38.6%
2018 millennial median household income: $54,655
14. Omaha, Nebraska (68106)

Median listing price: $163,188
Millennial home ownership rate: 43.2%
2018 millennial median household income: $59,663
13. Tracy, California (95376)
Median listing price: $440,807
Millennial home ownership rate: 38.4%
2018 millennial median household income: $67,098
12. Ferndale, Michigan (48220)
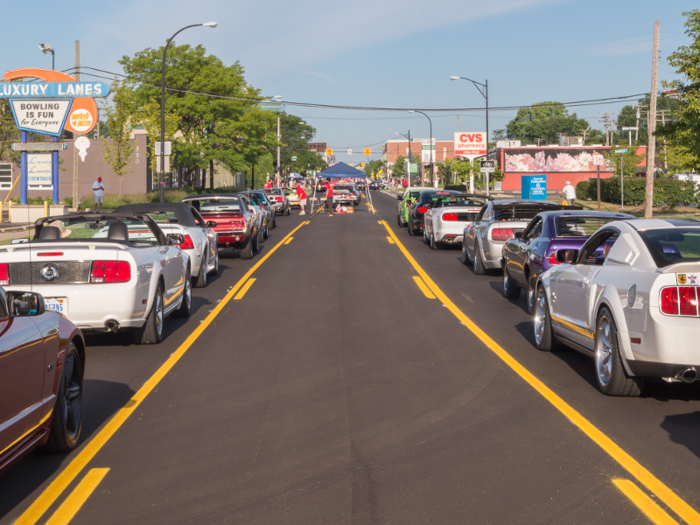
Median listing price: $185,907
Millennial home ownership rate: 45.5%
2018 millennial median household income: $61,567
11. Minneapolis, Minnesota (55434)

Median listing price: $231,235
Millennial home ownership rate: 78%
2018 millennial median household income: $77,088
10. Upper Montclair, New Jersey (07043)
Median listing price: $762,350
Millennial home ownership rate: 50.8%
2018 millennial median household income: $144,886
9. Rochester, New York (14624)

Median listing price: $131,964
Millennial home ownership rate: 63.7%
2018 millennial median household income: $70,259
8. Overland Park, Kansas
Median listing price: $261,927
Millennial home ownership rate: 23.5%
2018 millennial median household income: $78,336
7. Worthington, Ohio (43085)
Median listing price: $291,305
Millennial home ownership rate: 52.3%
2018 millennial median household income: $72,084
6. Boise, Idaho (83704)
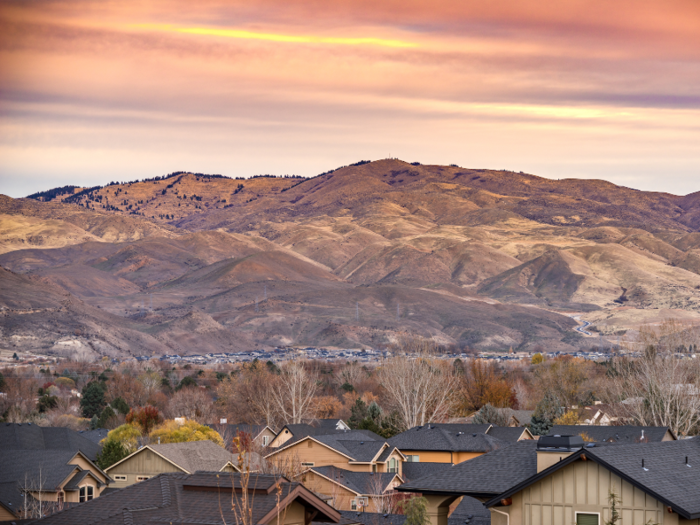
Median listing price: $251,324
Millennial home ownership rate: 38%
2018 millennial median household income: $49,074
5. Peabody, Massachusetts (01960)

Median listing price: $424,685
Millennial home ownership rate: 46.9%
2018 millennial median household income: $73,312
4. Castro Valley, California (94546)

Median listing price: $784,238
Millennial home ownership rate: 34%
2018 millennial median household income: $88,102
3. Watauga, Texas (76148)

Median listing price: $183,576
Millennial home ownership rate: 65.1%
2018 millennial median household income: $71,600
2. Colorado Springs, Colorado (80922)

Median listing price: $297,811
Millennial home ownership rate: 68%
2018 millennial median household income: $77,629
1. Kentwood, Michigan (49508)
Median listing price: $193,168
Millennial home ownership rate: 45.6%
2018 millennial median household income: $56,864

Popular Right Now
Popular Keywords
Advertisement