scorecardAbortion rates in the US are at their lowest levels in decades - these 6 maps and charts show how abortion in America has changed
  1. Home
  2. slideshows
  3. miscellaneous
  4. Abortion rates in the US are at their lowest levels in decades - these 6 maps and charts show how abortion in America has changed

Abortion rates in the US are at their lowest levels in decades - these 6 maps and charts show how abortion in America has changed

The US abortion rate has fallen from 21.3 abortions per 1,000 women in 2000 to 13.5 per 1,000 women in 2017.

Abortion rates in the US are at their lowest levels in decades - these 6 maps and charts show how abortion in America has changed

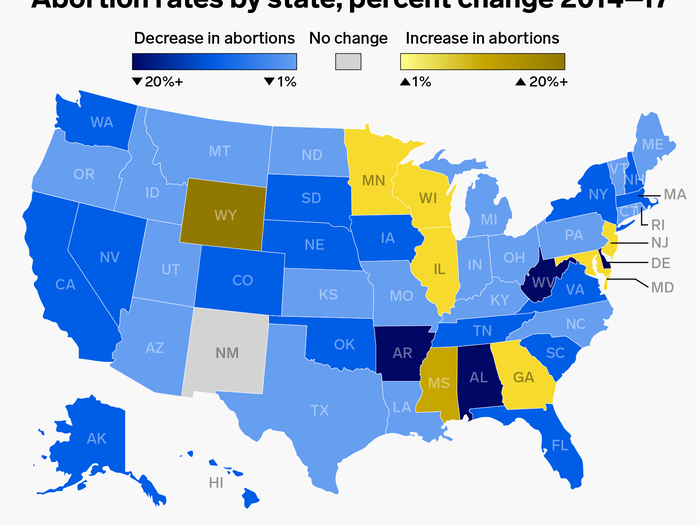
Here's how abortion rates have changed in every US state from 2014 to 2017.

Here

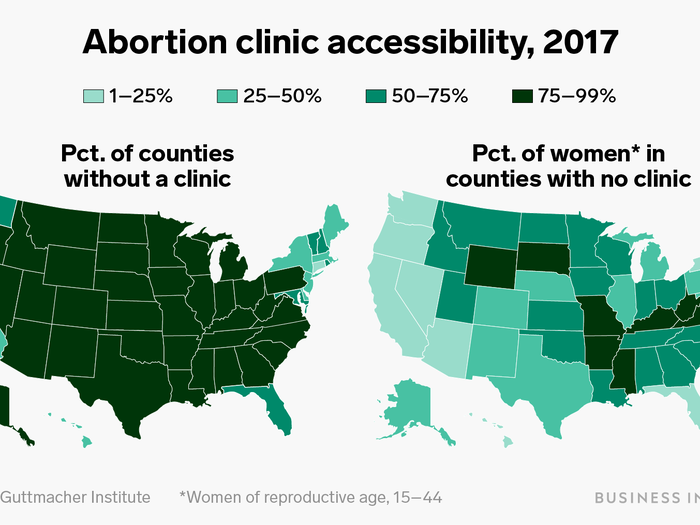
As of 2017, 89% of US counties have no abortion clinic, with 38% of women of reproductive age, defined as ages 15-44, living in those counties.

As of 2017, 89% of US counties have no abortion clinic, with 38% of women of reproductive age, defined as ages 15-44, living in those counties.

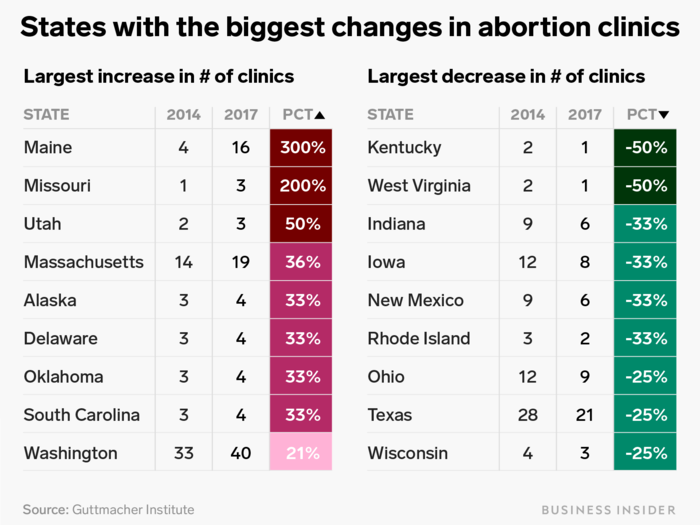
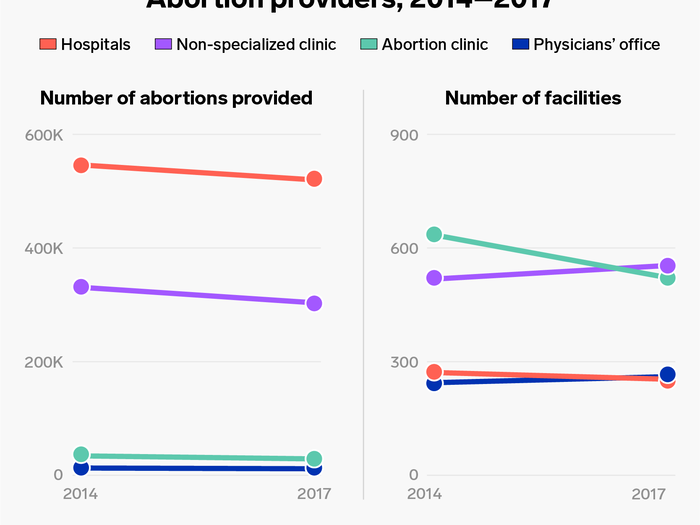
Predominately Northeastern and Western states gained new abortion providers in 2017, while the South and the Midwest lost the greatest proportion of abortion providers.

Predominately Northeastern and Western states gained new abortion providers in 2017, while the South and the Midwest lost the greatest proportion of abortion providers.

Here's a look at the percentage of abortion providers every US state gained or lost between 2014 and 2017.

Here

Advertisement