- Home
- slideshows
- miscellaneous
- 10 charts that show how America's population, economy, and government have changed since 9/11
10 charts that show how America's population, economy, and government have changed since 9/11
The population of the US has grown dramatically since 9/11.

The US economy has grown dramatically since 2001 as well.
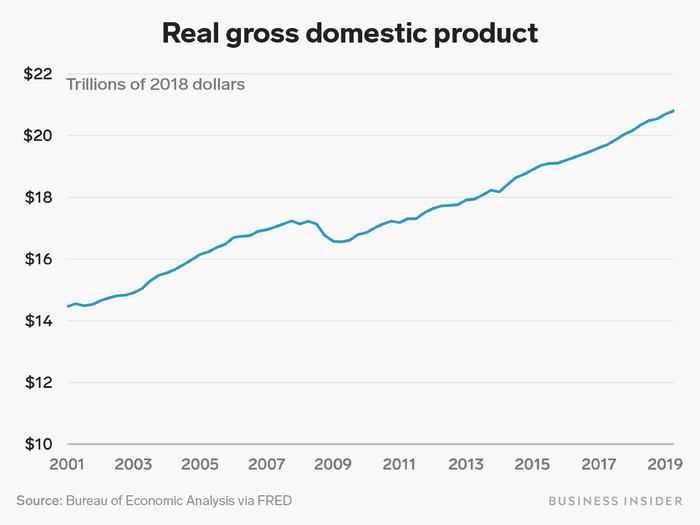
With the notable and major exception of the Great Recession in the late-2000s, real GDP, a broad measure of overall economic activity, has increased over the last 18 years.
The economy has seen its ups and downs in the last eighteen years.
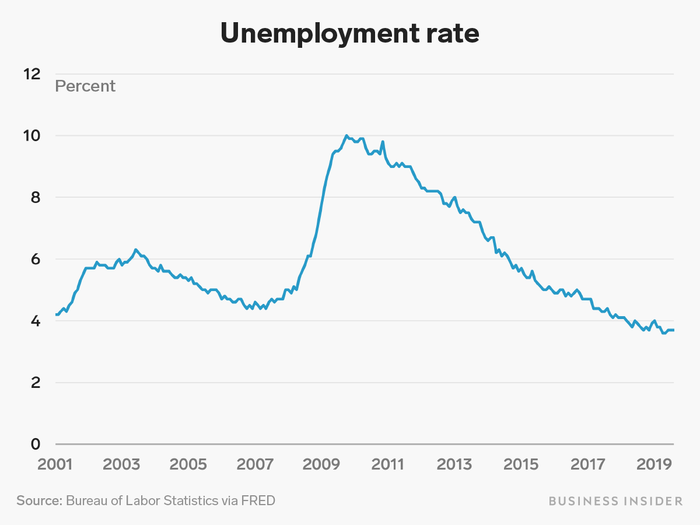
The dot-com bubble burst in 2001, leading to a relatively short and mild recession. Later in the decade, the collapse of the US housing market led to a massive financial crisis and much deeper recession followed by a slow but steady recovery over the next ten years.
The typical American family's standard of living has oscillated in the years since 2001, with recessions and recoveries having a big impact on how the economy is felt by normal people.
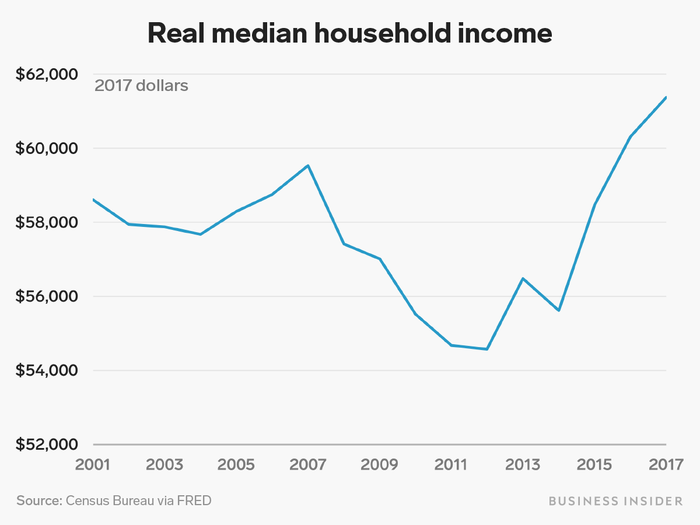
Median real household income, which measures the total income from work, investments, and other sources for a family or other group of people living together right in the middle of the income distribution, was mostly flat between 2001 and the onset of the Great Recession. After plummeting in the years after the economy took its dive, the typical household's finances have rebounded sharply since 2012.
Americans have become more highly educated since 2001.
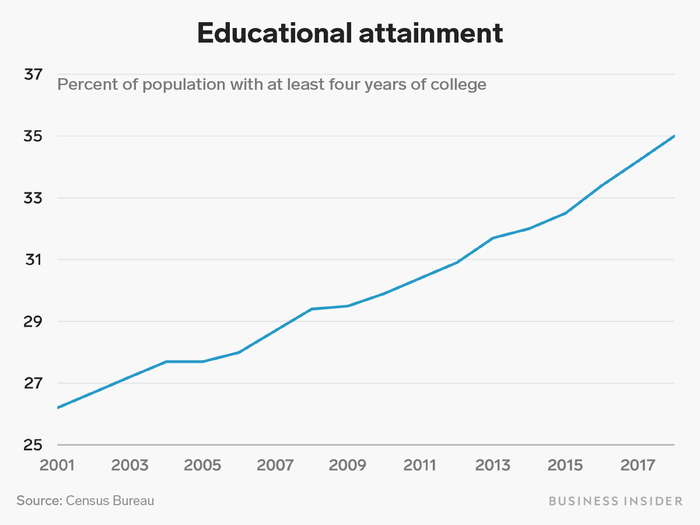
The share of adults over 25 with at least four years of college education rose from about 26% in 2001 to 35% in 2018.
America's population has been getting older since 2001.
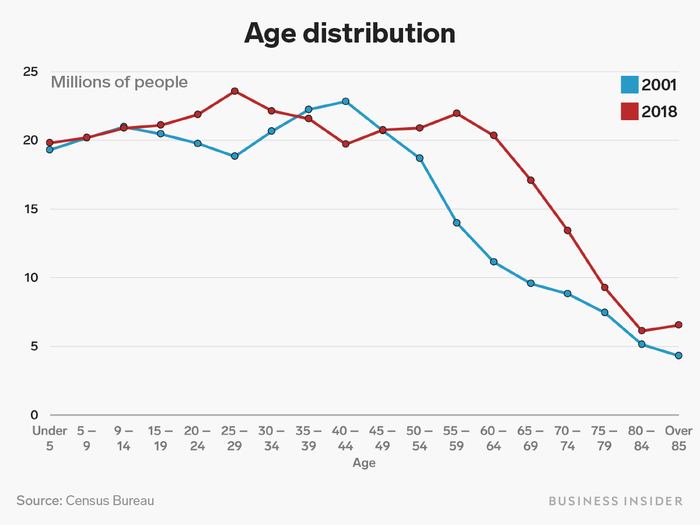
The blue line shows the age distribution, or the number of Americans in each of the indicated five-year age brackets, in 2001, and the red line shows the distribution in 2018. As the baby boomers have aged, there are many more Americans in their late 50s or older than there were in 2001. The 2018 curve also shows a spike of Americans in their 20s, representing the the children of boomers — that is, younger millennials and some of Gen Z — coming into adulthood.
The US has become more diverse since 2001.
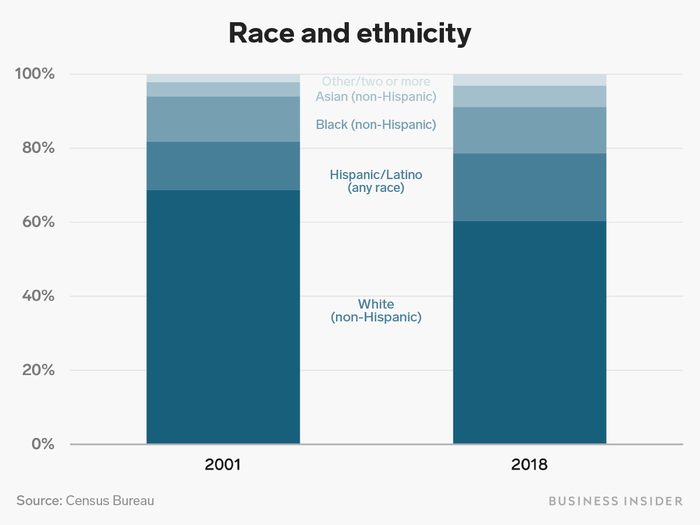
The racial and ethnic makeup of the US has been changing. Non-Hispanic whites made up 69% of the population in 2001, compared to 60% in 2018.
New Americans continue to arrive all the time.
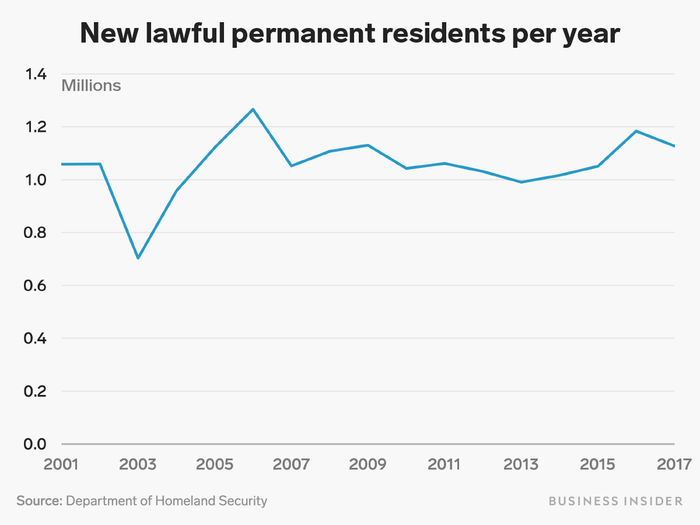
According to the Department of Homeland Security, about a million people have become lawful permanent residents of the US each year since 2001. According to an analysis of Census data by the Migration Policy Institute, as of 2017, 44.5 million US residents were born in another country, or about 13.7% of the population.
In response to the terrorist attacks on 9/11, a large part of the federal government was reorganized under the auspices of the Department of Homeland Security.
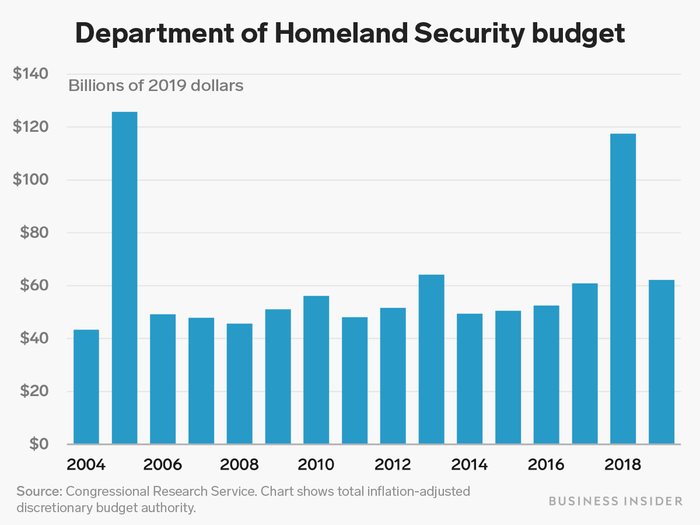
Several agencies dedicated to national security, disaster relief, and immigration and the border were moved to the department after its creation in 2002. The agency has a budget of around $60 billion in total as of fiscal year 2019, according to a Congressional Research Service report.
The US responded to the 9/11 attacks with the "Global War on Terror," leading to years of increased military spending.
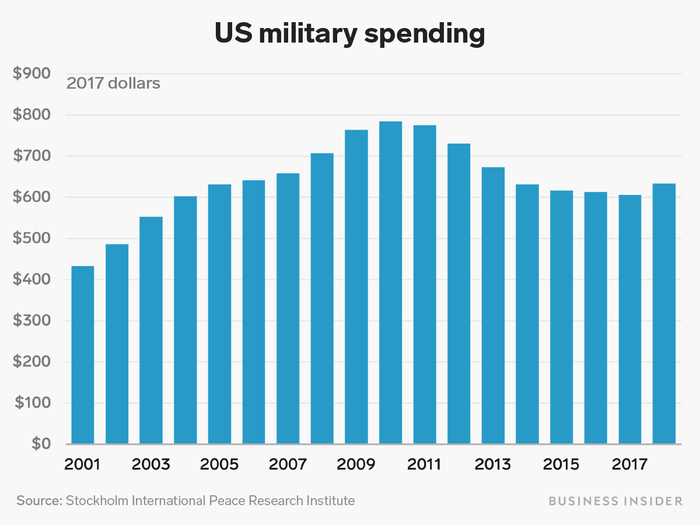
The war in Afghanistan that began after the attacks is ongoing to this day.
Popular Right Now
Popular Keywords
Advertisement