The 25 Most Segregated Cities In America
25. Miami-Fort Lauderdale-Pompano Beach, Florida

24. Los Angeles-Long Beach-Santa Ana, California
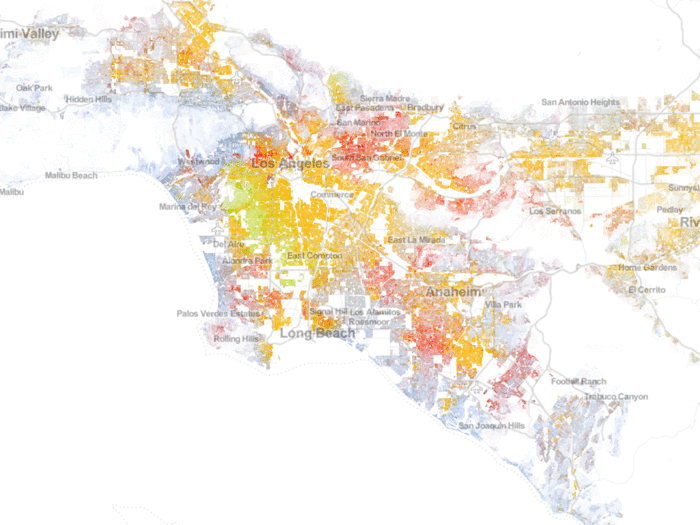
Blue = White; Green = Black; Yellow = Hispanic; Red = Asian; Brown = other
The Los Angeles-Long Beach-Santa Ana Metropolitan Statistical Area has dissimilarity scores of 65 for white-black, 62 for white-Hispanic, 45 for white-Asian, according to a study of 2010 Census data by professors John Logan and Brian Stults of Brown and Florida State University; and a score of 58.6 for overall dissimilarity, according to Business Insider's population-weighted index (scores over 60 show very high segregation).
23. Niles-Benton Harbor, Michigan
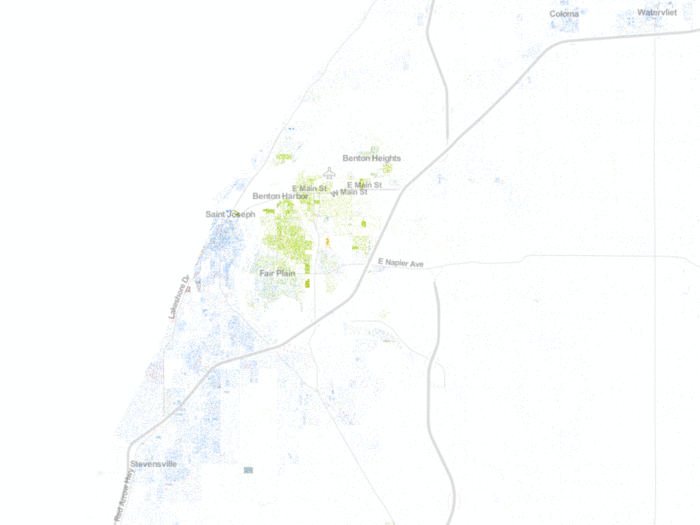
Blue = White; Green = Black; Yellow = Hispanic; Red = Asian; Brown = other
The Niles-Benton Harbor Metropolitan Statistical Area has dissimilarity scores of 69 for white-black, 31 for white-Hispanic, 42 for white-Asian, according to a study of 2010 Census data by professors John Logan and Brian Stults of Brown and Florida State University; and a score of 59.2 for overall dissimilarity, according to Business Insider's population-weighted index (scores over 60 show very high segregation).
22. Cincinnati-Middletown, Ohio-Kentucky-Indiana
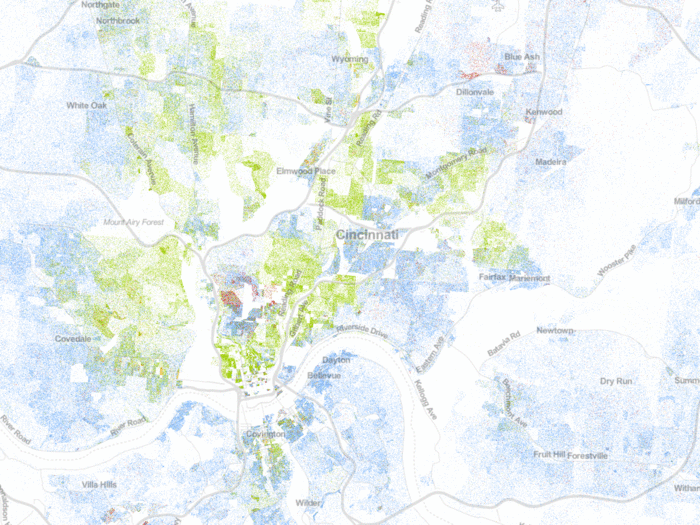
Blue = White; Green = Black; Yellow = Hispanic; Red = Asian; Brown = other
The Cincinnati-Middletown Metropolitan Statistical Area has dissimilarity scores of 67 for white-black, 37 for white-Hispanic, 42 for white-Asian, according to a study of 2010 Census data by professors John Logan and Brian Stults of Brown and Florida State University; and a score of 59.3 for overall dissimilarity, according to Business Insider's population-weighted index (scores over 60 show very high segregation).
21. Peoria, Illinois
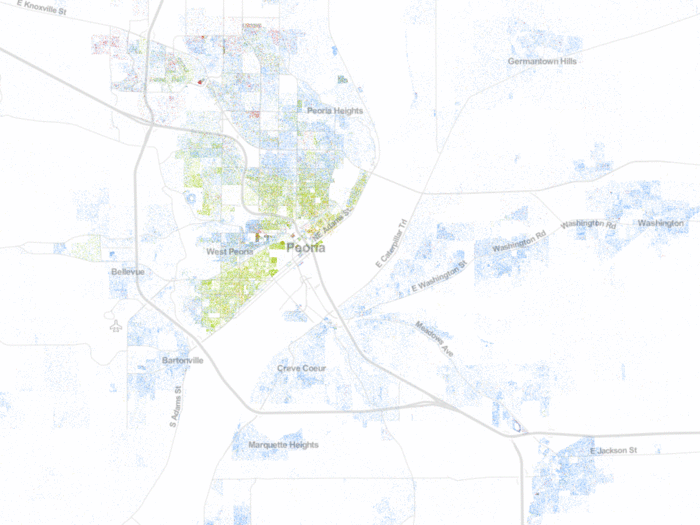
Blue = White; Green = Black; Yellow = Hispanic; Red = Asian; Brown = other
The Peoria Metropolitan Statistical Area has dissimilarity scores of 69 for white-black, 36 for white-Hispanic, 49 for white-Asian, according to a study of 2010 Census data by professors John Logan and Brian Stults of Brown and Florida State University; and a score of 59.8 for overall dissimilarity, according to Business Insider's population-weighted index (scores over 60 show very high segregation).
20. Springfield, Massachusetts
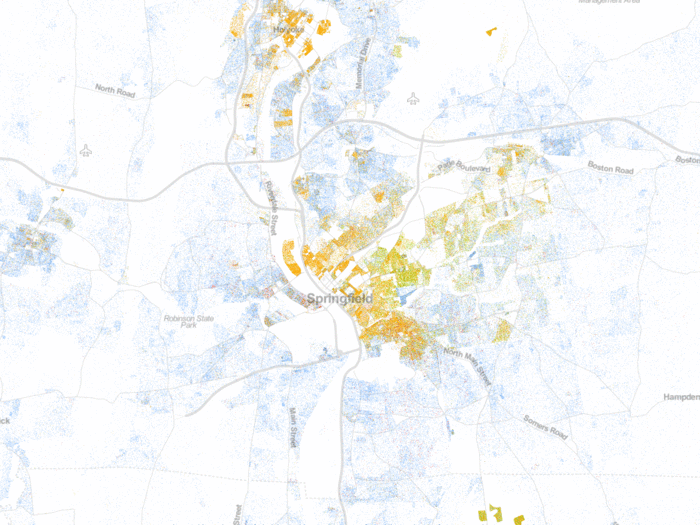
Blue = White; Green = Black; Yellow = Hispanic; Red = Asian; Brown = other
The Springfield, MA Metropolitan Statistical Area has dissimilarity scores of 62 for white-black, 63 for white-Hispanic, 37 for white-Asian, according to a study of 2010 Census data by professors John Logan and Brian Stults of Brown and Florida State University; and a score of 59.9 for overall dissimilarity, according to Business Insider's population-weighted index (scores over 60 show very high segregation).
19. Muskegon-Norton Shores, Michigan
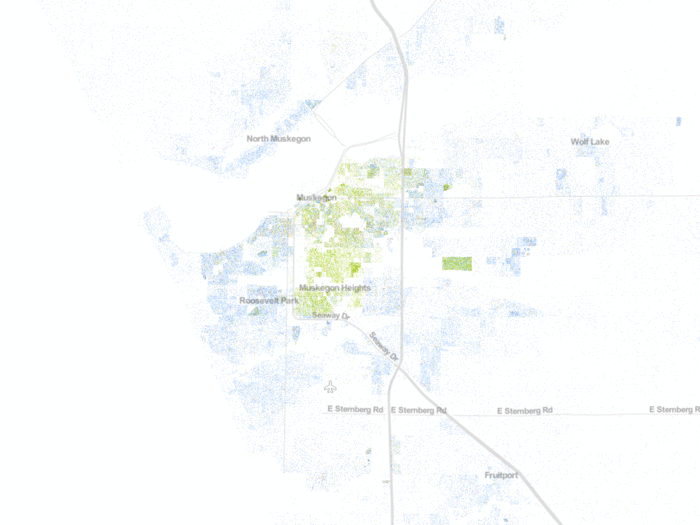
Blue = White; Green = Black; Yellow = Hispanic; Red = Asian; Brown = other
The Muskegon-Norton Shores Metropolitan Statistical Area has dissimilarity scores of 71 for white-black, 30 for white-Hispanic, 22 for white-Asian, according to a study of 2010 Census data by professors John Logan and Brian Stults of Brown and Florida State University; and a score of 60.0 for overall dissimilarity, according to Business Insider's population-weighted index (scores over 60 show very high segregation).
18. Pinebluff, Arkansas
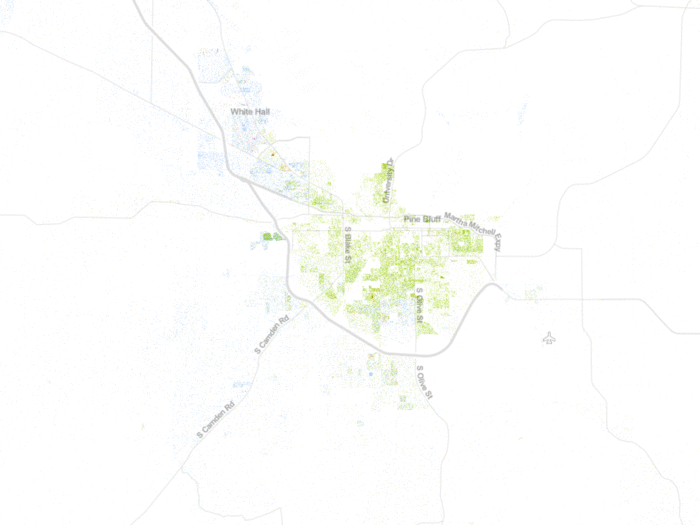
Blue = White; Green = Black; Yellow = Hispanic; Red = Asian; Brown = other
The Pinebluff Metropolitan Statistical Area has dissimilarity scores of 61 for white-black, 30 for white-Hispanic, 48 for white-Asian, according to a study of 2010 Census data by professors John Logan and Brian Stults of Brown and Florida State University; and a score of 60.0 for overall dissimilarity, according to Business Insider's population-weighted index (scores over 60 show very high segregation).
17. Youngstown-Warren-Boardman, Ohio-Pennsylvania
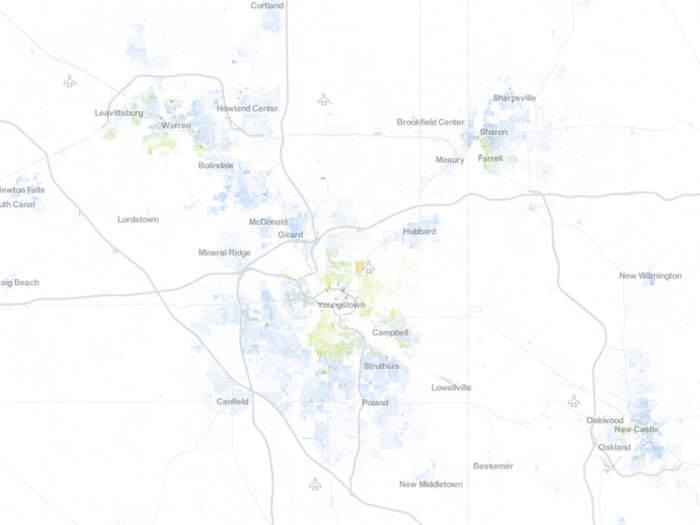
Blue = White; Green = Black; Yellow = Hispanic; Red = Asian; Brown = other
The Youngstown-Warren-Boardman Metropolitan Statistical Area has dissimilarity scores of 65 for white-black, 46 for white-Hispanic, 32 for white-Asian, according to a study of 2010 Census data by professors John Logan and Brian Stults of Brown and Florida State University; and a score of 60.1 for overall dissimilarity, according to Business Insider's population-weighted index (scores over 60 show very high segregation).
16. Philadelphia-Camden-Wilmington, Pennsylvania-New Jersey-Delaware-Maryland

Blue = White; Green = Black; Yellow = Hispanic; Red = Asian; Brown = other
The Philadelphia-Camden-Wilmington Metropolitan Statistical Area has dissimilarity scores of 67 for white-black, 55 for white-Hispanic, 40 for white-Asian, according to a study of 2010 Census data by professors John Logan and Brian Stults of Brown and Florida State University; and a score of 60.1 for overall dissimilarity, according to Business Insider's population-weighted index (scores over 60 show very high segregation).
15. Memphis, Tennessee-Missouri-Arkansas
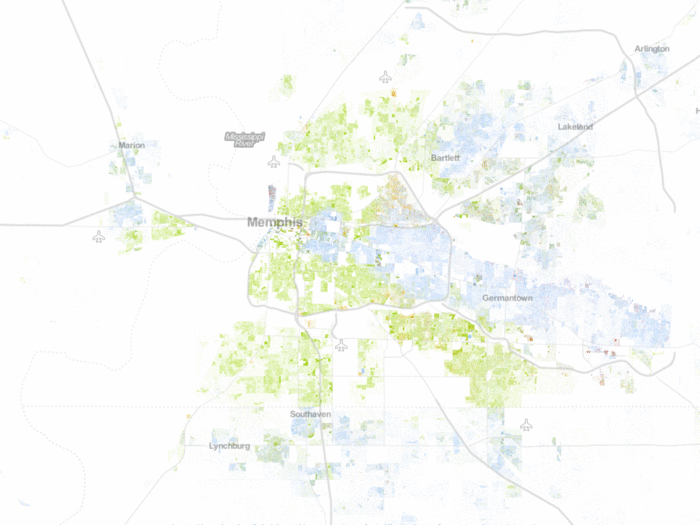
Blue = White; Green = Black; Yellow = Hispanic; Red = Asian; Brown = other
The Memphis Metropolitan Statistical Area has dissimilarity scores of 62 for white-black, 51 for white-Hispanic, 37 for white-Asian, according to a study of 2010 Census data by professors John Logan and Brian Stults of Brown and Florida State University; and a score of 60.1 for overall dissimilarity, according to Business Insider's population-weighted index (scores over 60 show very high segregation).
14. Flint, Michigan
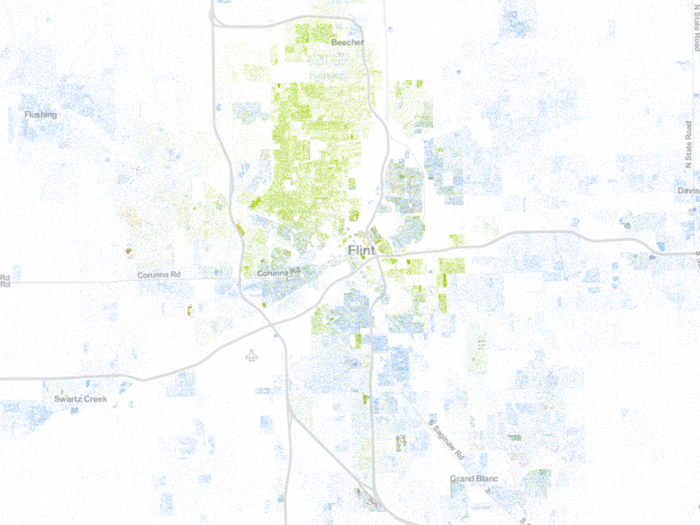
Blue = White; Green = Black; Yellow = Hispanic; Red = Asian; Brown = other
The Flint Metropolitan Statistical Area has dissimilarity scores of 67 for white-black, 23 for white-Hispanic, 36 for white-Asian, according to a study of 2010 Census data by professors John Logan and Brian Stults of Brown and Florida State University; and a score of 60.7 for overall dissimilarity, according to Business Insider's population-weighted index (scores over 60 show very high segregation).
13. Monroe, Louisiana
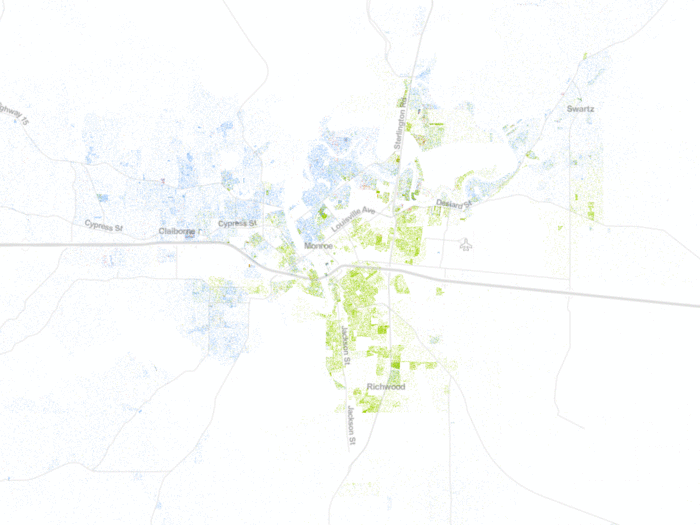
Blue = White; Green = Black; Yellow = Hispanic; Red = Asian; Brown = other
The Monroe Metropolitan Statistical Area has dissimilarity scores of 63 for white-black, 32 for white-Hispanic, 35 for white-Asian, according to a study of 2010 Census data by professors John Logan and Brian Stults of Brown and Florida State University; and a score of 60.9 for overall dissimilarity, according to Business Insider's population-weighted index (scores over 60 show very high segregation).
12. Beaumont-Port Arthur, Texas
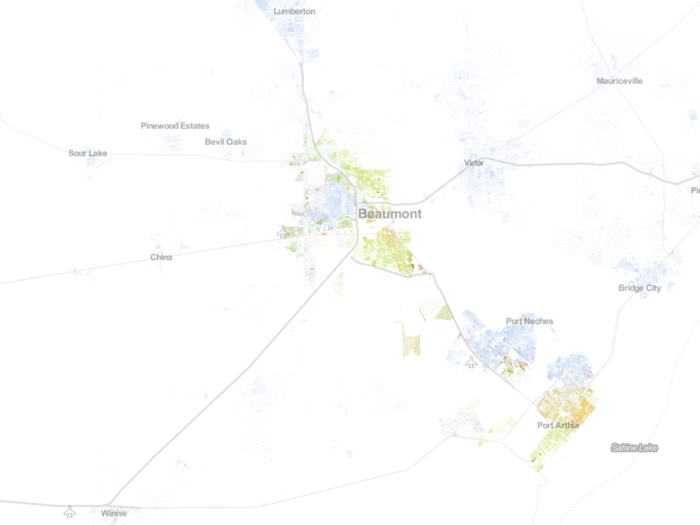
Blue = White; Green = Black; Yellow = Hispanic; Red = Asian; Brown = other
The Beaumont-Port Arthur Metropolitan Statistical Area has dissimilarity scores of 67 for white-black, 51 for white-Hispanic, 51 for white-Asian, according to a study of 2010 Census data by professors John Logan and Brian Stults of Brown and Florida State University; and a score of 60.9 for overall dissimilarity, according to Business Insider's population-weighted index (scores over 60 show very high segregation).
11. Danville, Illinois
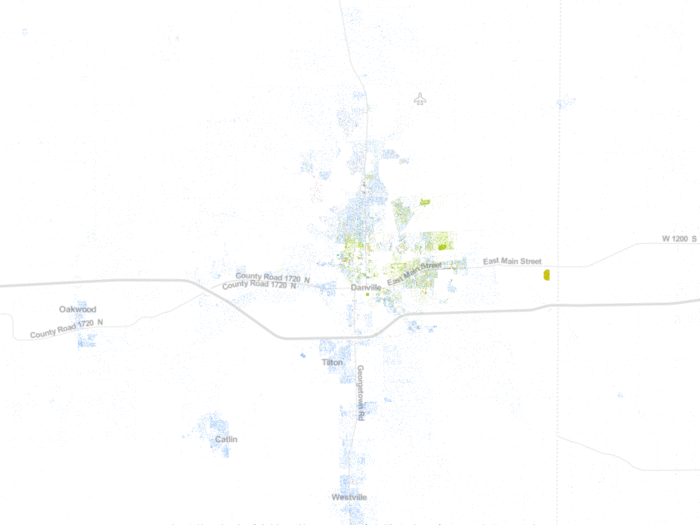
Blue = White; Green = Black; Yellow = Hispanic; Red = Asian; Brown = other
The Danville Metropolitan Statistical Area has dissimilarity scores of 68 for white-black, 43 for white-Hispanic, 41 for white-Asian, according to a study of 2010 Census data by professors John Logan and Brian Stults of Brown and Florida State University; and a score of 61.2 for overall dissimilarity, according to Business Insider's population-weighted index (scores over 60 show very high segregation).
10. Gadsen, Alabama
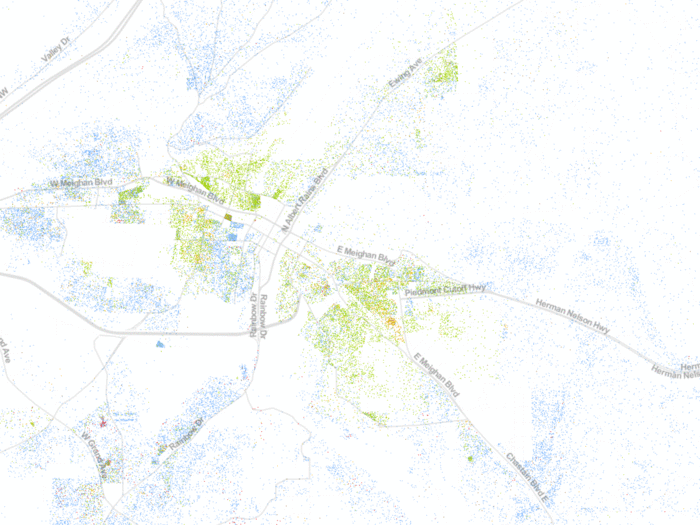
Blue = White; Green = Black; Yellow = Hispanic; Red = Asian; Brown = other
The Gadsen Metropolitan Statistical Area has dissimilarity scores of 66 for white-black, 44 for white-Hispanic, 38 for white-Asian, according to a study of 2010 Census data by professors John Logan and Brian Stults of Brown and Florida State University; and a score of 61.5 for overall dissimilarity, according to Business Insider's population-weighted index (scores over 60 show very high segregation).
9. Reading, Pennsylvania
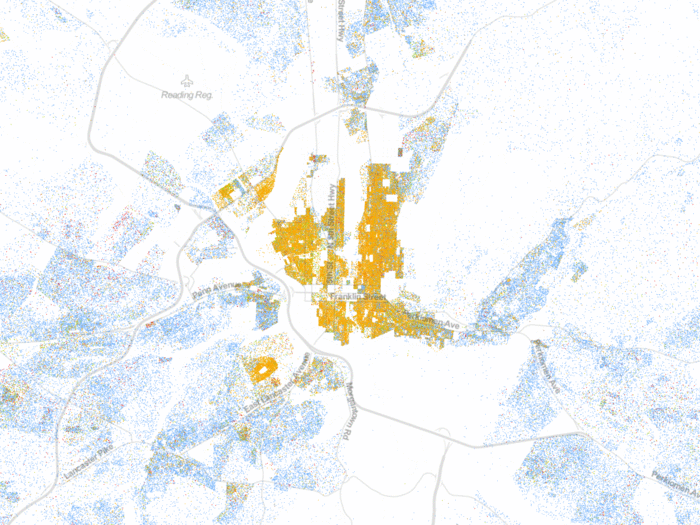
Blue = White; Green = Black; Yellow = Hispanic; Red = Asian; Brown = other
The Reading, Pennsylvania Metropolitan Statistical Area has dissimilarity scores of 47 for white-black, 69 for white-Hispanic, 30 for white-Asian, according to a study of 2010 Census data by professors John Logan and Brian Stults of Brown and Florida State University; and a score of 61.5 for overall dissimilarity, according to Business Insider's population-weighted index (scores over 60 show very high segregation).
8. Birmingham-Hoover, Alabama
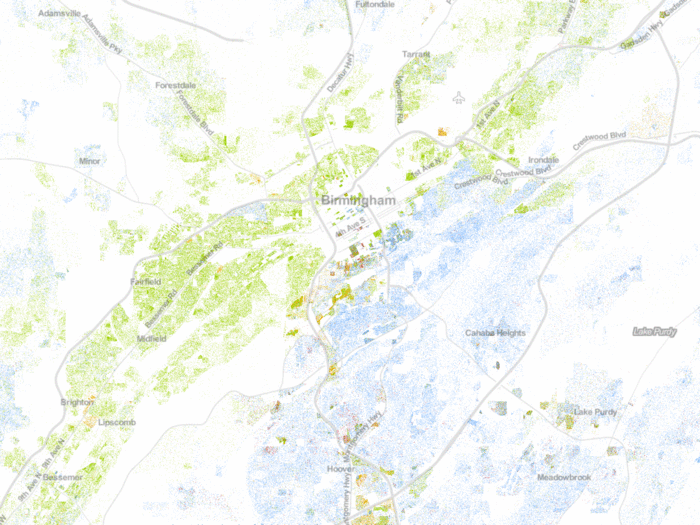
Blue = White; Green = Black; Yellow = Hispanic; Red = Asian; Brown = other
The Birmingham-Hoover, Alabama Metropolitan Statistical Area has dissimilarity scores of 65 for white-black, 45 for white-Hispanic, 43 for white-Asian, according to a study of 2010 Census data by professors John Logan and Brian Stults of Brown and Florida State University; and a score of 61.7 for overall dissimilarity, according to Business Insider's population-weighted index (scores over 60 show very high segregation).
7. Chicago-Joliet-Naperville, Illinois-Indiana-Wisconsin
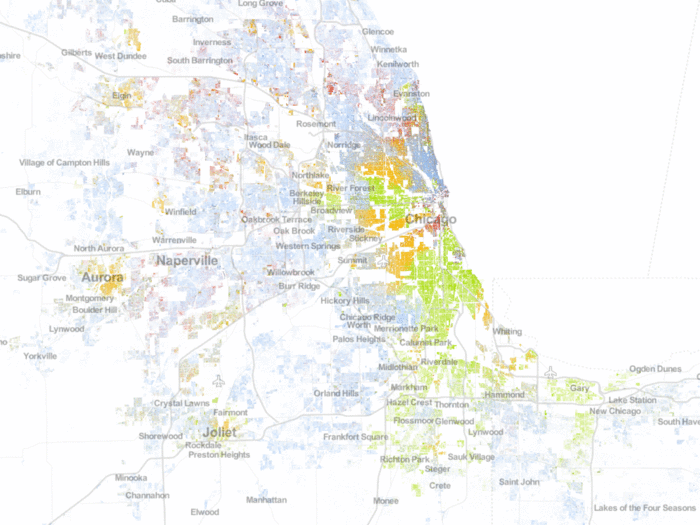
Blue = White; Green = Black; Yellow = Hispanic; Red = Asian; Brown = other
The Chicago-Joliet-Naperville, Illinois-Indiana-Wisconsin Metropolitan Statistical Area has dissimilarity scores of 76 for white-black, 57 for white-Hispanic, 42 for white-Asian, according to a study of 2010 Census data by professors John Logan and Brian Stults of Brown and Florida State University; and a score of 61.9 for overall dissimilarity, according to Business Insider's population-weighted index (scores over 60 show very high segregation).
6. St. Louis, Missouri-Illinois
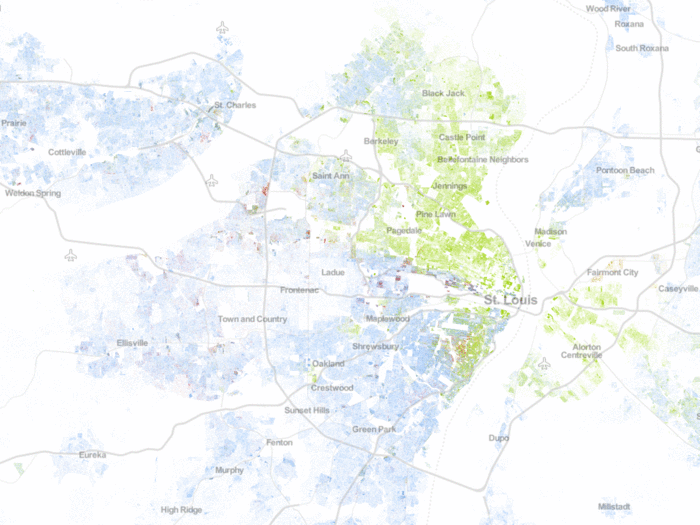
Blue = White; Green = Black; Yellow = Hispanic; Red = Asian; Brown = other
The St. Louis, Missouri-Illinois Metropolitan Statistical Area has dissimilarity scores of 71 for white-black, 31 for white-Hispanic, 41 for white-Asian, according to a study of 2010 Census data by professors John Logan and Brian Stults of Brown and Florida State University; and a score of 63.2 for overall dissimilarity, according to Business Insider's population-weighted index (scores over 60 show very high segregation).
5. Buffalo-Niagara Falls, NY
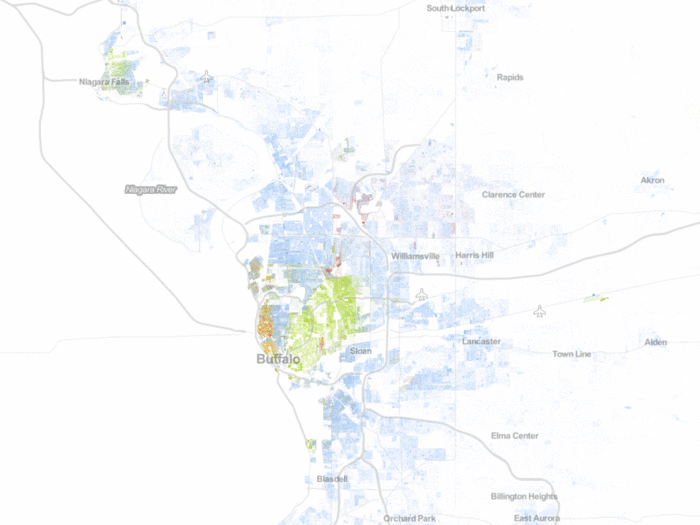
Blue = White; Green = Black; Yellow = Hispanic; Red = Asian; Brown = other
The Buffalo-Niagara Falls, NY Metropolitan Statistical Area has dissimilarity scores of 71 for white-black, 51 for white-Hispanic, 51 for white-Asian, according to a study of 2010 Census data by professors John Logan and Brian Stults of Brown and Florida State University; and a score of 64.0 for overall dissimilarity, according to Business Insider's population-weighted index (scores over 60 show very high segregation).
4. New York-Northern New Jersey-Long Island, New York-New Jersey-Pennsylvania
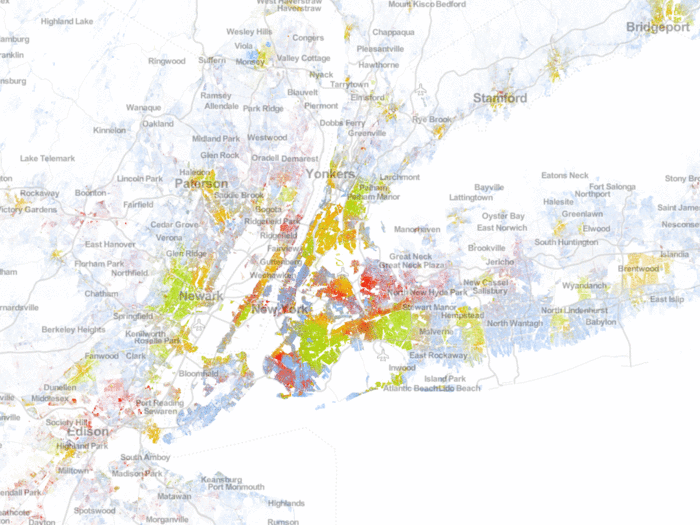
Blue = White; Green = Black; Yellow = Hispanic; Red = Asian; Brown = other
The New York-Northern New Jersey-Long Island, New York-New Jersey-Pennsylvania Metropolitan Statistical Area has dissimilarity scores of 77 for white-black, 62 for white-Hispanic, 51 for white-Asian, according to a study of 2010 Census data by professors John Logan and Brian Stults of Brown and Florida State University; and a score of 64.5 for overall dissimilarity, according to Business Insider's population-weighted index (scores over 60 show very high segregation).
3. Cleveland-Elyria-Mentor, Ohio
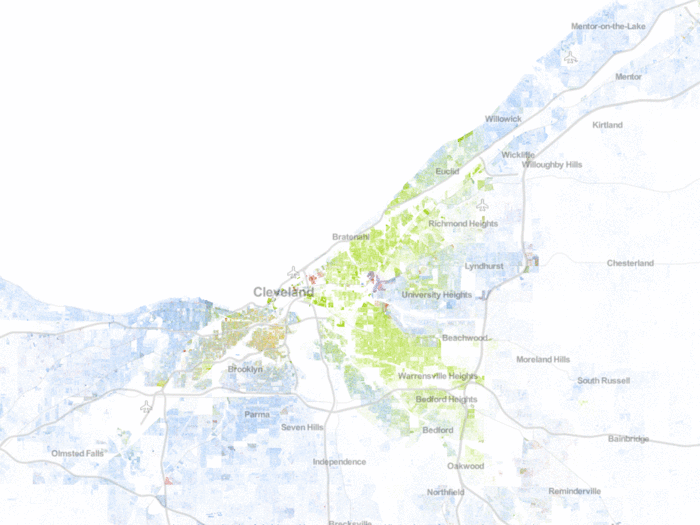
Blue = White; Green = Black; Yellow = Hispanic; Red = Asian; Brown = other
The Cleveland-Elyria-Mentor, Ohio Metropolitan Statistical Area has dissimilarity scores of 73 for white-black, 52 for white-Hispanic, 38 for white-Asian, according to a study of 2010 Census data by professors John Logan and Brian Stults of Brown and Florida State University; and a score of 66.2 for overall dissimilarity, according to Business Insider's population-weighted index (scores over 60 show very high segregation).
2. Detroit-Warren-Livonia, Michigan
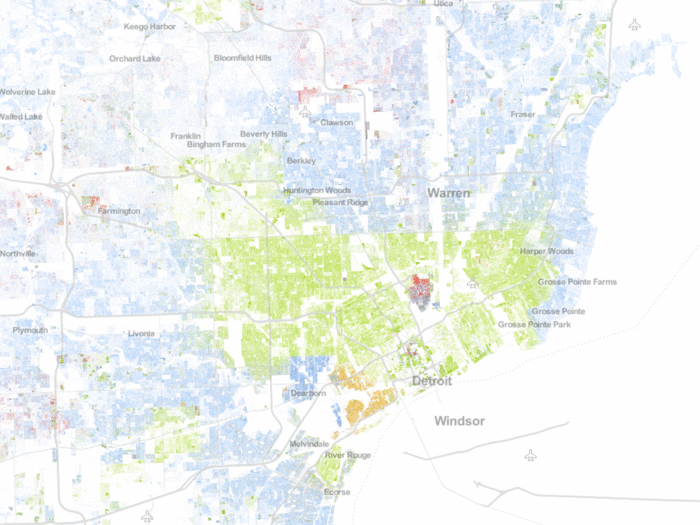
Blue = White; Green = Black; Yellow = Hispanic; Red = Asian; Brown = other
The Detroit-Warren-Livonia, Michigan Metropolitan Statistical Area has dissimilarity scores of 74 for white-black, 43 for white-Hispanic, 46 for white-Asian, according to a study of 2010 Census data by professors John Logan and Brian Stults of Brown and Florida State University; and a score of 66.7 for overall dissimilarity, according to Business Insider's population-weighted index (scores over 60 show very high segregation).
1. Milwaukee-Waukesha-West Allis, Wisconsin
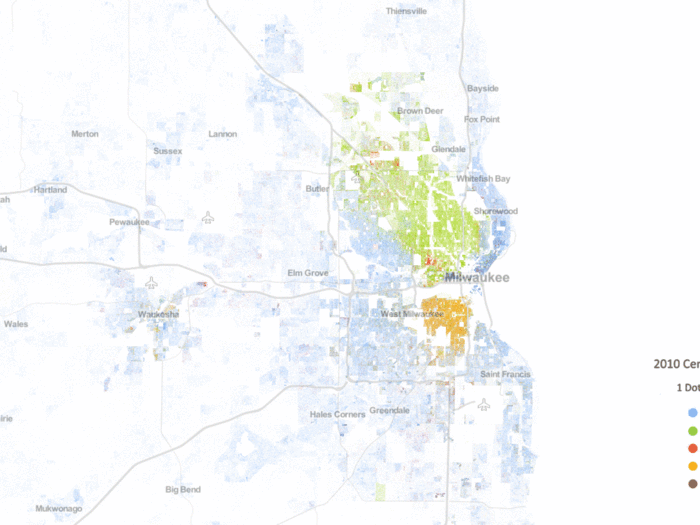
Blue = White; Green = Black; Yellow = Hispanic; Red = Asian; Brown = other
The Milwaukee-Waukesha-West Allis, Wisconsin Metropolitan Statistical Area has dissimilarity scores of 80 for white-black, 57 for white-Hispanic, 38 for white-Asian, according to a study of 2010 Census data by professors John Logan and Brian Stults of Brown and Florida State University; and a score of 67.9 for overall dissimilarity, according to Business Insider's population-weighted index (scores over 60 show very high segregation).
You've seen the most racially segregated cities in America
Popular Right Now
Popular Keywords
Advertisement