21 Maps Of Highly Segregated Cities In America
COLUMBUS, Ohio — Blacks (blue dots) cluster in the inner city.

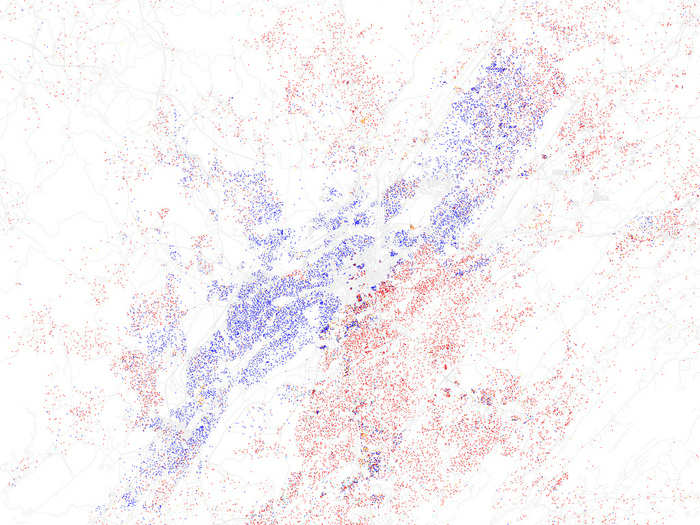
HOUSTON, Texas — Blacks, Hispanics (orange dots), and whites (red dots) fan out in separate communities.
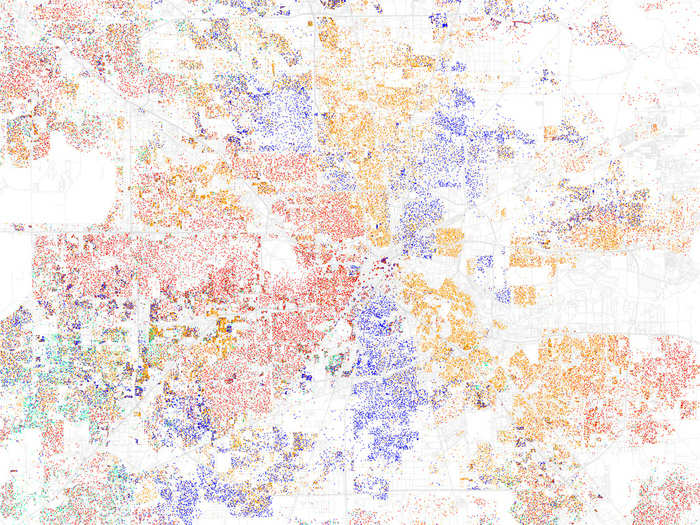
Houston's black-white dissimilarity score is 60.6, according to a study of 2010 Census data by professors John Logan and Brian Stults of Brown and Florida State University. A score above 60 on the dissimilarity index is considered very high segregation.
The red dots show white people, blue is black, orange is Hispanic, green is Asian, and yellow is other, according to maps of 2010 Census data by Eric Fischer.
MEMPHIS, Tenn. — Black people live in the inner city and other segregated neighborhoods.
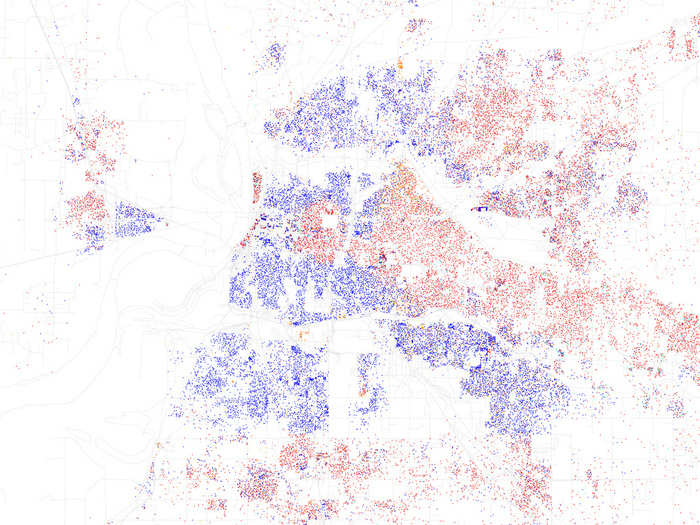
Memphis's black-white dissimilarity score is 60.6, according to a study of 2010 Census data by professors John Logan and Brian Stults of Brown and Florida State University. A score above 60 on the dissimilarity index is considered very high segregation.
The red dots show white people, blue is black, orange is Hispanic, green is Asian, and yellow is other, according to maps of 2010 Census data by Eric Fischer.
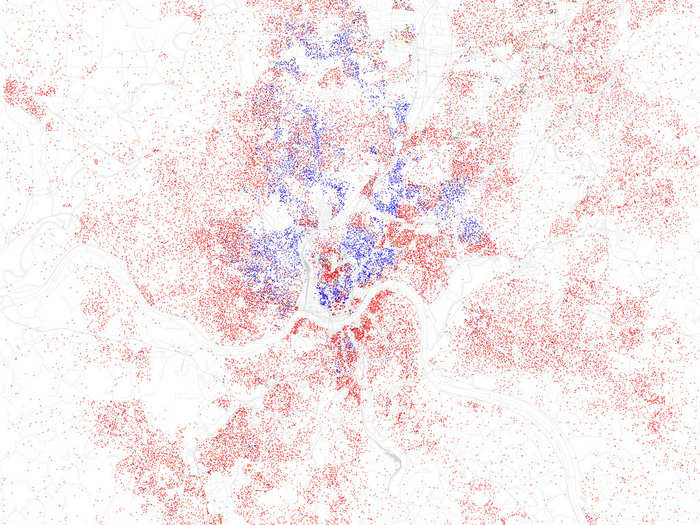
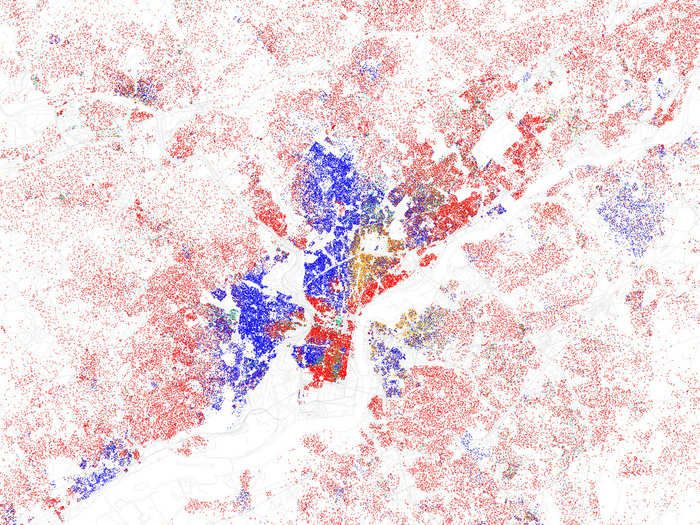
PITTSBURGH, Penn. — Black people stick to a few areas on the east side.
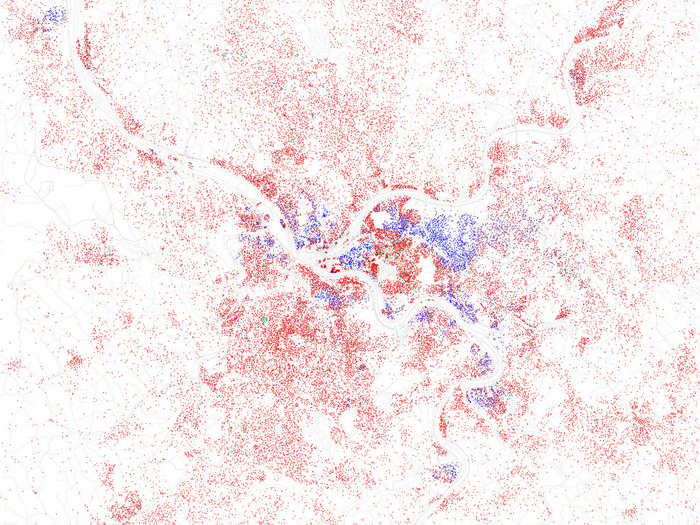
Pittsburgh's black-white dissimilarity score is 63.1, according to a study of 2010 Census data by professors John Logan and Brian Stults of Brown and Florida State University. A score above 60 on the dissimilarity index is considered very high segregation.
The red dots show white people, blue is black, orange is Hispanic, green is Asian, and yellow is other, according to maps of 2010 Census data by Eric Fischer.
NEW ORLEANS, La. — Hurricane Katrina led to a major decline in segregation. Many wards remain highly segregated.
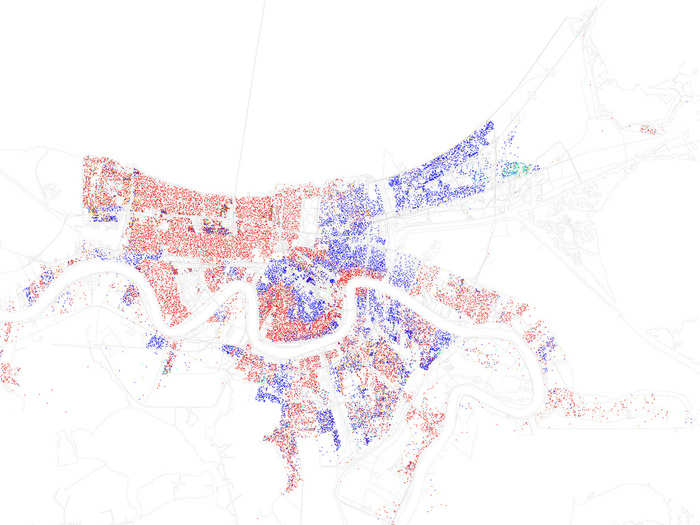
New Orleans's black-white dissimilarity score is 63.3, according to a study of 2010 Census data by professors John Logan and Brian Stults of Brown and Florida State University. A score above 60 on the dissimilarity index is considered very high segregation.
The red dots show white people, blue is black, orange is Hispanic, green is Asian, and yellow is other, according to maps of 2010 Census data by Eric Fischer.
WASHINGTON, D.C. — White people have gentrified much of downtown D.C., pushing black people to outer Southeast, Northeast, Anacostia, and the Maryland suburbs.
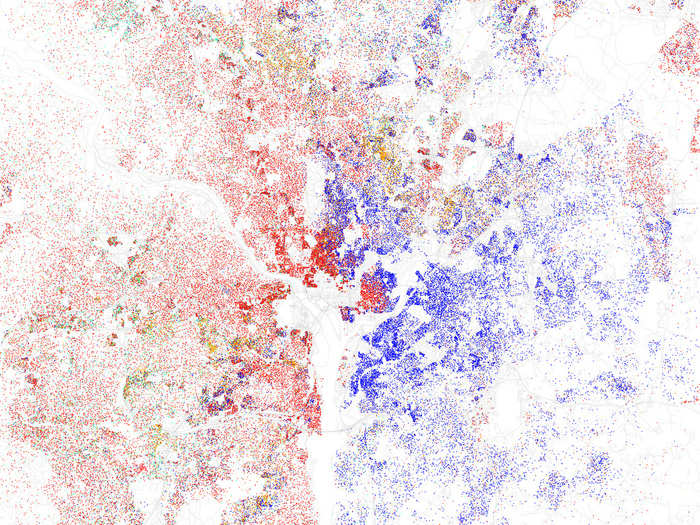
The D.C. metropolitan area's black-white dissimilarity score is 64.1, according to a study of 2010 Census data by professors John Logan and Brian Stults of Brown and Florida State University. A score above 60 on the dissimilarity index is considered very high segregation.
The red dots show white people, blue is black, orange is Hispanic, green is Asian, and yellow is other, according to maps of 2010 Census data by Eric Fischer.
BALTIMORE, Md. — Black people live mostly in the inner city and in the western suburbs.
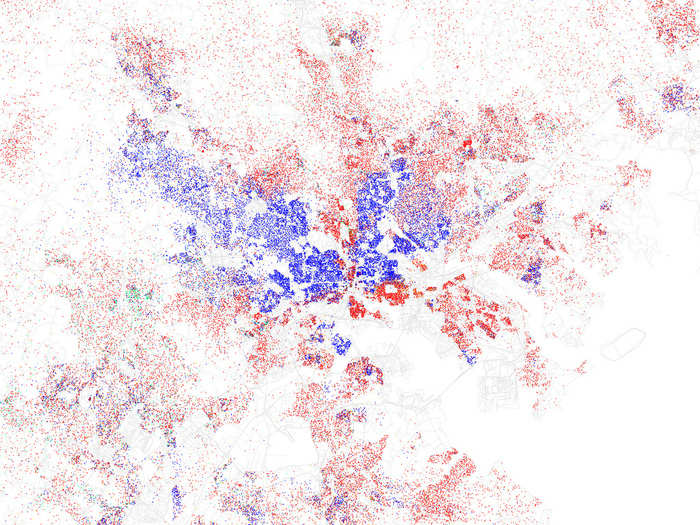
Baltimore's black-white dissimilarity score is 64.3, according to a study of 2010 Census data by professors John Logan and Brian Stults of Brown and Florida State University. A score above 60 on the dissimilarity index is considered very high segregation.
The red dots show white people, blue is black, orange is Hispanic, green is Asian, and yellow is other, according to maps of 2010 Census data by Eric Fischer.
INDIANAPOLIS, Ind. — Black people live mainly in the northern part of the city.
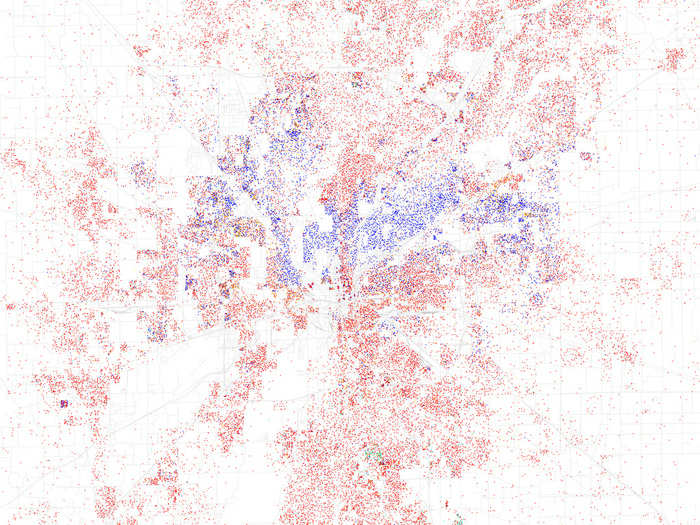
Indianapolis's black-white dissimilarity score is 64.5, according to a study of 2010 Census data by professors John Logan and Brian Stults of Brown and Florida State University. A score above 60 on the dissimilarity index is considered very high segregation.
The red dots show white people, blue is black, orange is Hispanic, green is Asian, and yellow is other, according to maps of 2010 Census data by Eric Fischer.
LOS ANGELES, Calif. — White people cling to the coast around Santa Monica and Brentwood, and the north side of the city beginning with the Hollywood Hills.
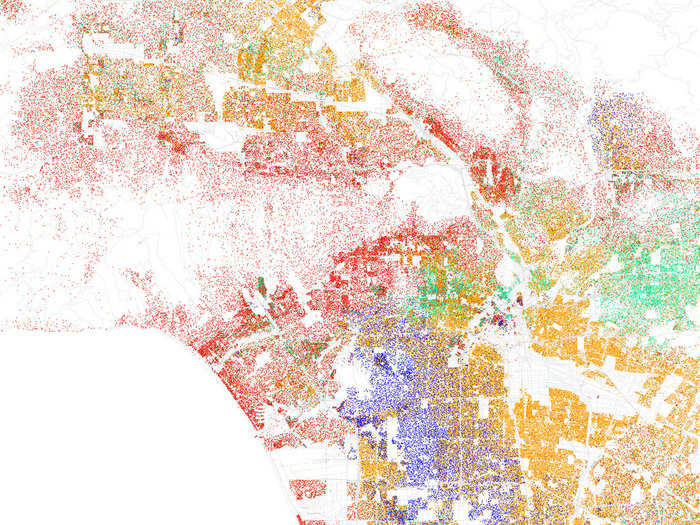
L.A.'s black-white dissimilarity score is 65.0, according to a study of 2010 Census data by professors John Logan and Brian Stults of Brown and Florida State University. A score above 60 on the dissimilarity index is considered very high segregation.
The red dots show white people, blue is black, orange is Hispanic, green is Asian, and yellow is other, according to maps of 2010 Census data by Eric Fischer.
BIRMINGHAM, Ala. — Blacks live mostly west of I-59, and whites stay on the east side of the major highway.
Birmingham's black-white dissimilarity score is 65.2, according to a study of 2010 Census data by professors John Logan and Brian Stults of Brown and Florida State University. A score above 60 on the dissimilarity index is considered very high segregation.
The red dots show white people, blue is black, orange is Hispanic, green is Asian, and yellow is other, according to maps of 2010 Census data by Eric Fischer.
CINCINNATI, Ohio — Black people live in downtown and in scattered pockets around the northern part of the city.
Cincinnati's black-white dissimilarity score is 66.9, according to a study of 2010 Census data by professors John Logan and Brian Stults of Brown and Florida State University. A score above 60 on the dissimilarity index is considered very high segregation.
The red dots show white people, blue is black, orange is Hispanic, green is Asian, and yellow is other, according to maps of 2010 Census data by Eric Fischer.
BOSTON, Mass. — Black people live almost exclusively on the south side of the city in Roxbury and Dorchester.
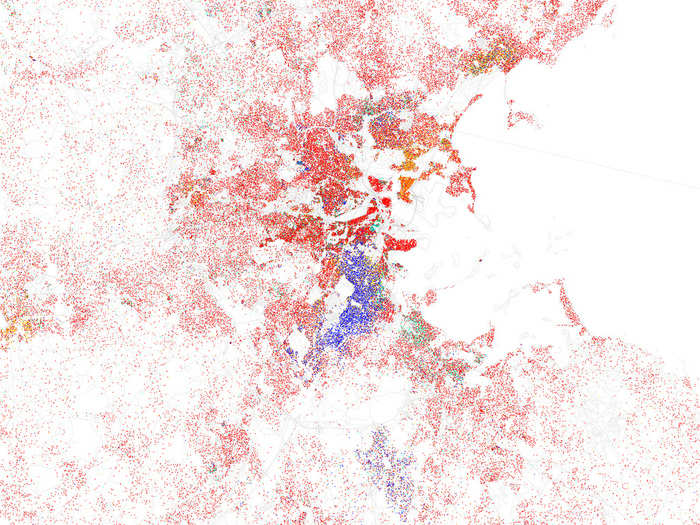
Boston's black-white dissimilarity score is 67.8, according to a study of 2010 Census data by professors John Logan and Brian Stults of Brown and Florida State University. A score above 60 on the dissimilarity index is considered very high segregation.
The red dots show white people, blue is black, orange is Hispanic, green is Asian, and yellow is other, according to maps of 2010 Census data by Eric Fischer.
ST. LOUIS, Mo. — Black people live mostly on the north side of the city, extending into the suburbs.
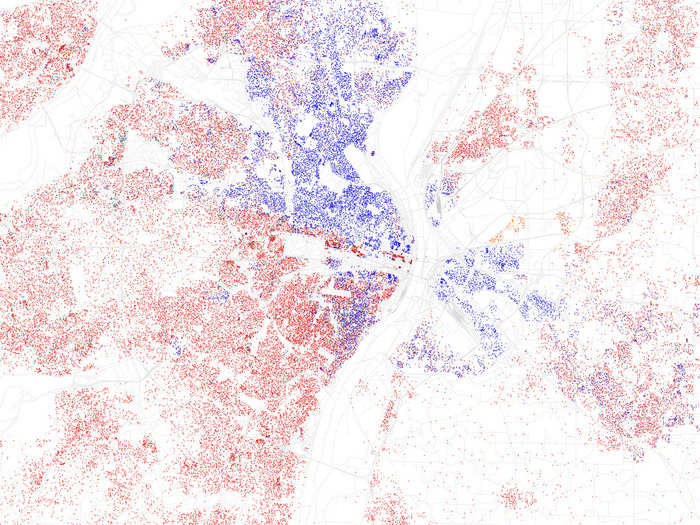
St Louis's black-white dissimilarity score is 69.2, according to a study of 2010 Census data by professors John Logan and Brian Stults of Brown and Florida State University. A score above 60 on the dissimilarity index is considered very high segregation.
The red dots show white people, blue is black, orange is Hispanic, green is Asian, and yellow is other, according to maps of 2010 Census data by Eric Fischer.
CLEVELAND, Ohio — Black people live mainly on the east side of the city.
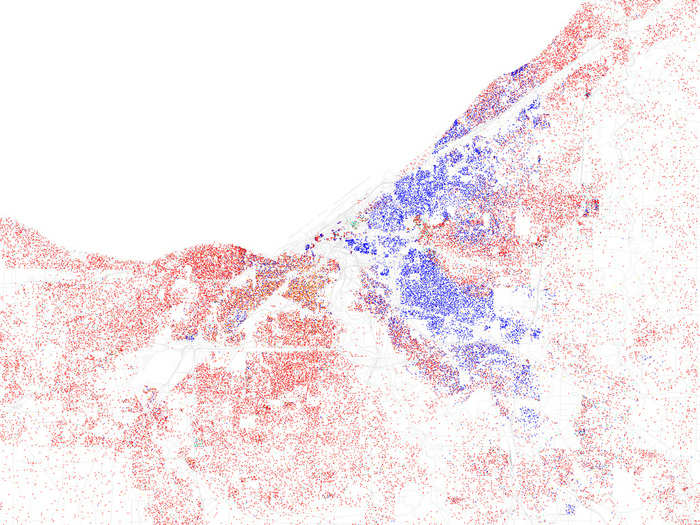
Cleveland's black-white dissimilarity score is 72.6, according to a study of 2010 Census data by professors John Logan and Brian Stults of Brown and Florida State University. A score above 60 on the dissimilarity index is considered very high segregation.
The red dots show white people, blue is black, orange is Hispanic, green is Asian, and yellow is other, according to maps of 2010 Census data by Eric Fischer.
MIAMI, Fla. — Black people live mainly in the northern inner city (Little Haiti and Wynwood), Hispanics in the south (Little Havana, West Miami, Coral Way) and west (Brownsville).
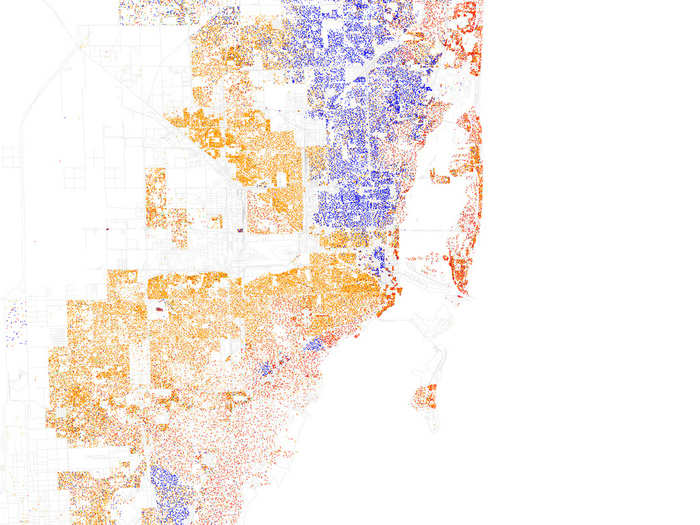
Miami's black-white dissimilarity score is 73.0, according to a study of 2010 Census data by professors John Logan and Brian Stults of Brown and Florida State University. A score above 60 on the dissimilarity index is considered very high segregation.
The red dots show white people, blue is black, orange is Hispanic, green is Asian, and yellow is other, according to maps of 2010 Census data by Eric Fischer.
PHILADELPHIA, Pa. — North and West Philadelphia remain stayed heavily black, with a pocket of Hispanics. White people stick to South and Northeast Philly and the suburbs.
Philadelphia's black-white dissimilarity score is 73.7, according to a study of 2010 Census data by professors John Logan and Brian Stults of Brown and Florida State University. A score above 60 on the dissimilarity index is considered very high segregation.
The red dots show white people, blue is black, orange is Hispanic, green is Asian, and yellow is other, according to maps of 2010 Census data by Eric Fischer.
CHICAGO, Ill. — North side neighborhoods like Edgewater and the Gold Coast are heavily white. Black people live on the West and South Sides. Hispanics live in southwest and northwest corners of the city.
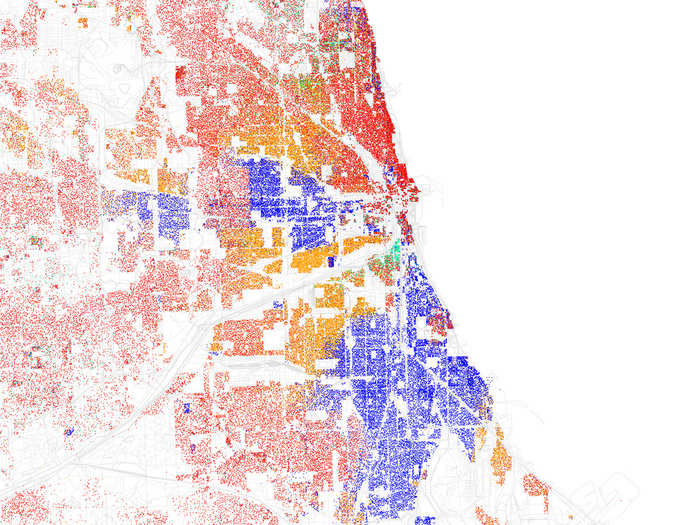
Chicago's black-white dissimilarity score is 75.9, according to a study of 2010 Census data by professors John Logan and Brian Stults of Brown and Florida State University. A score above 60 on the dissimilarity index is considered very high segregation.
The red dots show white people, blue is black, orange is Hispanic, green is Asian, and yellow is other, according to maps of 2010 Census data by Eric Fischer.
NEWARK, N.J. — Most of downtown Newark is black, with small pockets of Hispanics in the northeast and southeast parts of the city and white people living at the edges, going out into the wealthier suburbs.
Newark's black-white dissimilarity score is 78.0, according to a study of 2010 Census data by professors John Logan and Brian Stults of Brown and Florida State University. A score above 60 on the dissimilarity index is considered very high segregation.
The red dots show white people, blue is black, orange is Hispanic, green is Asian, and yellow is other, according to maps of 2010 Census data by Eric Fischer.
NEW YORK, N.Y. — Most of Manhattan is white south of 125th Street, with the exception of Chinatown. South Brooklyn is mostly white, with pockets of Asians and Hispanics, and Northeast Brooklyn going into Queens is heavily black. Queens and the Bronx are highly diverse.
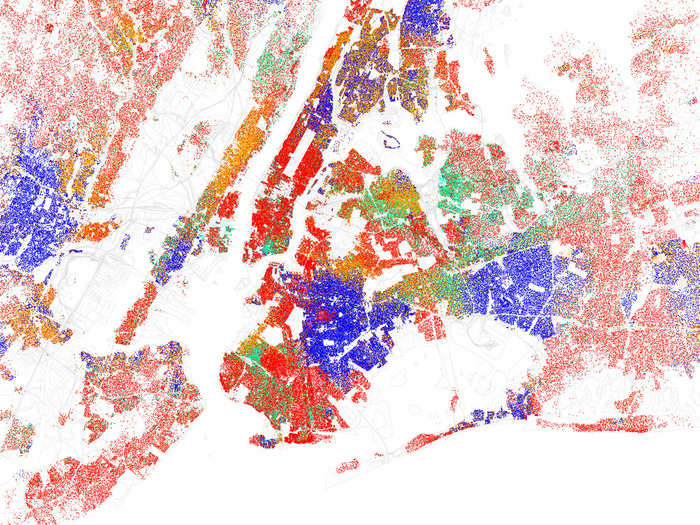
The New York City area's black-white dissimilarity score is 79.1, according to a study of 2010 Census data by professors John Logan and Brian Stults of Brown and Florida State University. A score above 60 on the dissimilarity index is considered very high segregation.
The red dots show white people, blue is black, orange is Hispanic, green is Asian, and yellow is other, according to maps of 2010 Census data by Eric Fischer.
MILWAUKEE, Wis. — Blacks live in the north-central area, Hispanics stay in the southern inner city near Humboldt Park, and white people live on the edges and in the suburbs.
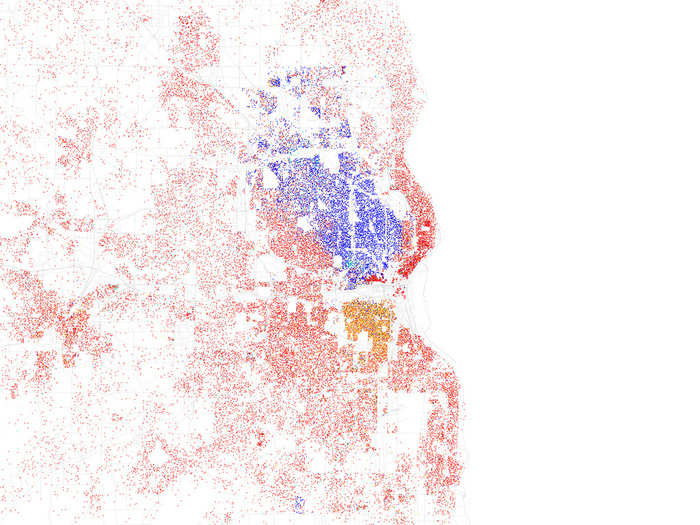
Milwaukee's black-white dissimilarity score is 79.6, according to a study of 2010 Census data by professors John Logan and Brian Stults of Brown and Florida State University. A score above 60 on the dissimilarity index is considered very high segregation.
The red dots show white people, blue is black, orange is Hispanic, green is Asian, and yellow is other, according to maps of 2010 Census data by Eric Fischer.
DETROIT, Mich. — The most segregated city in America, Detroit's inner city is almost exclusively black, except for a small Hispanic corner in the southwest called "Mexicantown." The suburbs like Grosse Pointe, Dearborn, and Ferndale are heavily white.
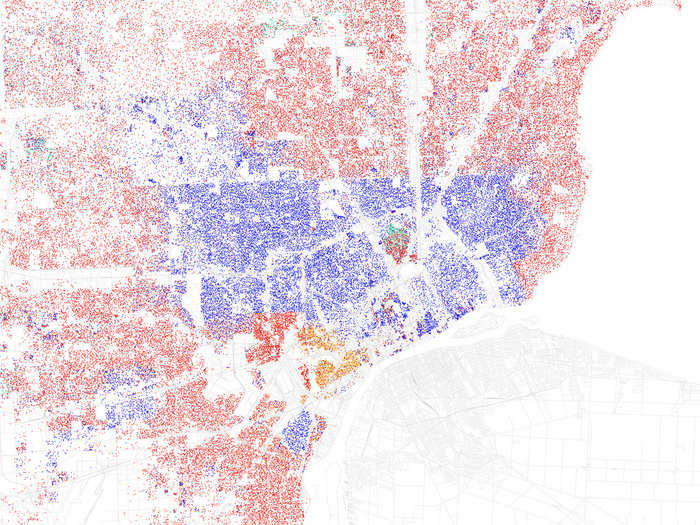
Detroit's black-white dissimilarity score is 79.6, according to a study of 2010 Census data by professors John Logan and Brian Stults of Brown and Florida State University. A score above 60 on the dissimilarity index is considered very high segregation.
The red dots show white people, blue is black, orange is Hispanic, green is Asian, and yellow is other, according to maps of 2010 Census data by Eric Fischer.
Popular Right Now
Advertisement