
Want to know how our galaxy grew from its infancy to the bright spiral galaxy we see today? Here’s a chart to your rescue. Researchers have created the first-ever 'growth chart' for
The chart uses the ages of more than 70,000 stars and extends halfway across our galaxy to 50,000 light-years away.
"Close to the centre of our galaxy, we see old stars that were formed when it was young and small. Farther out, we see young stars. We conclude that our galaxy grew up by growing out," Melissa Ness from the Max Planck Institute for Astronomy in Heidelberg in Germany, who led the study, told PTI.
"To see this, we needed an age map spanning large distances, and that is what this new discovery gives us," she added.
Researchers mapped the galaxy by observing red giants, bright stars in the final stages of their lives that can be observed out to large distances from our Sun, into the very inner and outer reaches of the Milky Way.
"If we know the mass of a red giant star, we know its age by using the fusion clock inside every star. Finding masses of red giant stars has historically been very difficult, but surveys of the galaxy have made new, revolutionary techniques possible," said Marie Martig, co-author of the study.
Researchers started with spectra taken from one of the Sloan Digital Sky Survey (SDSS)'s component surveys, the Apache Point Observatory Galaxy Evolution Experiment (APOGEE).
"APOGEE is the ideal survey for this work because it can get high-quality spectra for 300 stars simultaneously over a large area of sky," said Steve Majewski, principal investigator of the APOGEE survey.
"Seeing so many stars at once means getting spectra of 70,000 red giants is actually possible with a single telescope in a few years' time," he added.
The ages of stars cannot be measured with APOGEE spectra alone, but the APOGEE team realised that light curves from the Kepler
APOGEE therefore observed thousands of red giants that had also been seen by Kepler. After combining information from the APOGEE spectra and Kepler lightcurves, the researchers could then apply their methods to measure ages for all 70,000 red giant stars sampling all parts of the galaxy.
"In the galaxy we know best - our own - we can clearly read the story of how galaxies form in a universe with large amounts of cold dark matter," said Ness.
"Because we can see so many individual stars in the Milky Way, we can chart its growth in unprecedented detail. This unprecedented, enormous map really is one for the ages," she added.
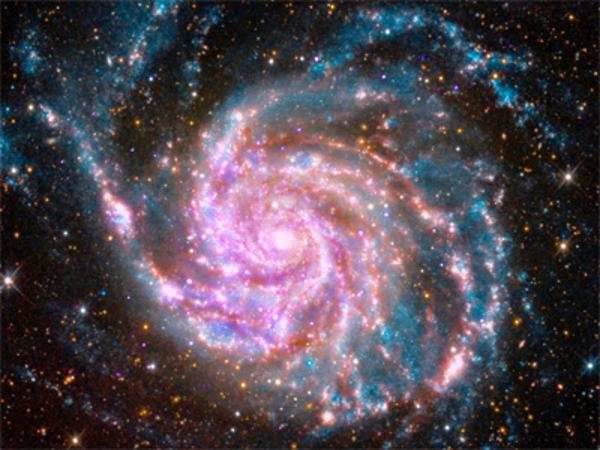
(Image credits: indiatimes)